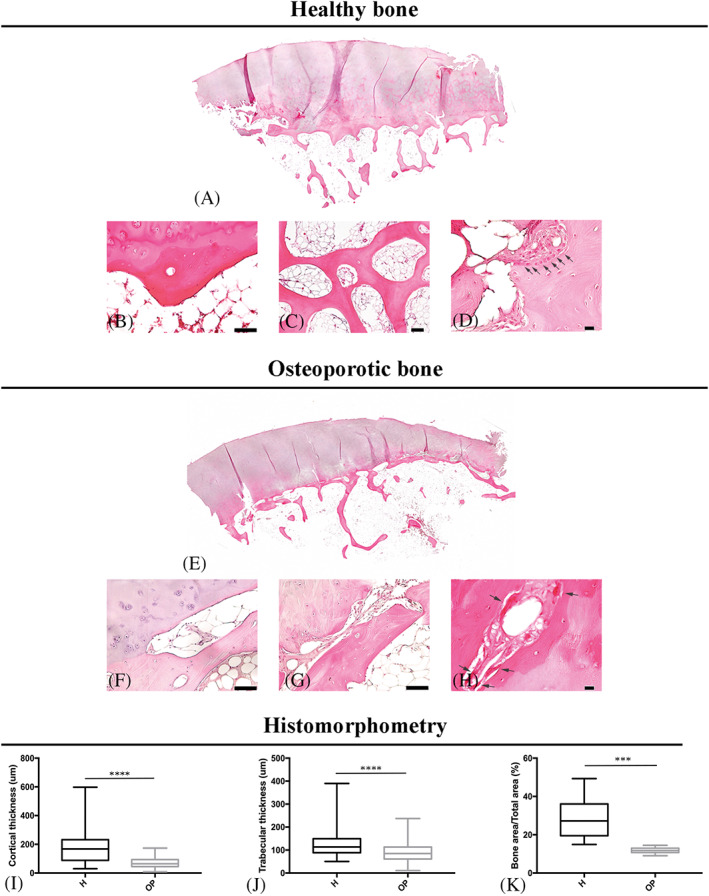
FIGURE 1.

Morphological features of hematoxylin & eosin‐stained bone tissues from healthy (A–D) and osteoporotic (E–H) subjects and histomorphometrical evaluation (I–K). (A) Mosaic of bone tissue section images; (B) osteon in cortical bone (×20 magnification, 50 μm scale bar); (C) trabecular bone interconnections (×10 magnification, 100 μm scale bar); (D) bone formation zone in cortical bone (black arrows indicate OBs; ×40 magnification, 10 μm scale bar); (E) mosaic of bone tissue section images; (F–G) depletion and “trabecularization” of cortical bone (×20 magnification, 50 μm scale bar); (H) bone resorption zone in cortical bone (black arrows indicate OCs; ×40 magnification, 10 μm scale bar); graphical representation of (I) cortical thickness, (H) trabecular thickness and (K) bone area values in healthy (H) and osteoporotic (OP) bone
