
FIGURE 3.
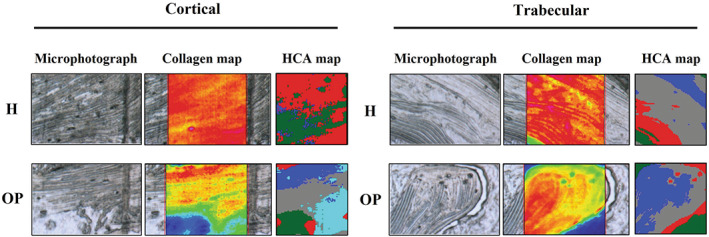
Representative microphotographs of healthy (H) and osteoporotic (OP) samples, in the cortical and trabecular regions; false color images showing the topographical distribution of collagen, and corresponding HCA maps
Official websites use .gov
A
.gov website belongs to an official
government organization in the United States.
Secure .gov websites use HTTPS
A lock (
) or https:// means you've safely
connected to the .gov website. Share sensitive
information only on official, secure websites.
Representative microphotographs of healthy (H) and osteoporotic (OP) samples, in the cortical and trabecular regions; false color images showing the topographical distribution of collagen, and corresponding HCA maps