
FIGURE 4.
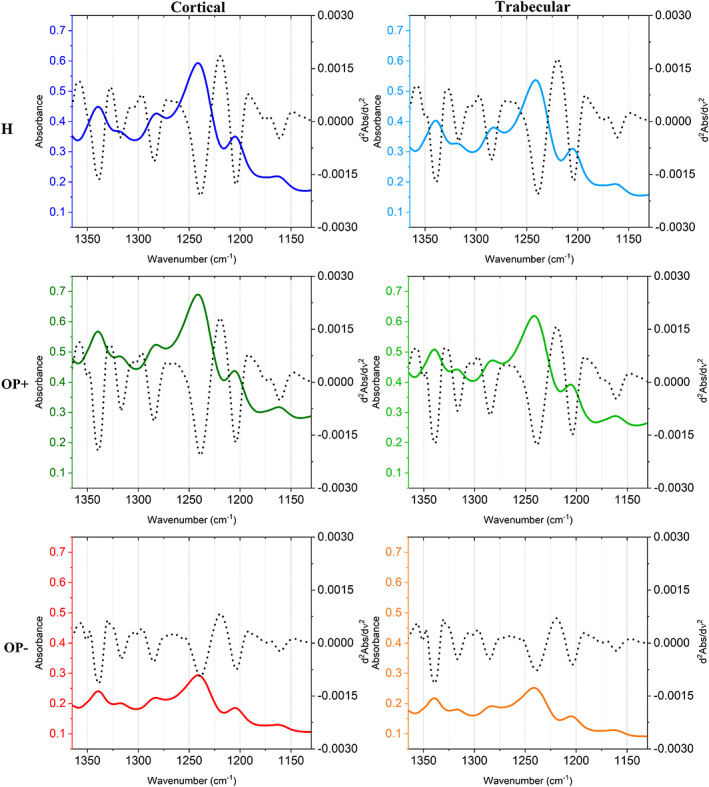
Average spectra of healthy bones (H), collagen‐rich areas of osteoporotic bones (OP+), and collagen‐poor areas of osteoporotic bones (OP–) in cortical and trabecular regions, in the 1360–1130 cm−1 spectral range
Official websites use .gov
A
.gov website belongs to an official
government organization in the United States.
Secure .gov websites use HTTPS
A lock (
) or https:// means you've safely
connected to the .gov website. Share sensitive
information only on official, secure websites.
Average spectra of healthy bones (H), collagen‐rich areas of osteoporotic bones (OP+), and collagen‐poor areas of osteoporotic bones (OP–) in cortical and trabecular regions, in the 1360–1130 cm−1 spectral range