
FIGURE 5.
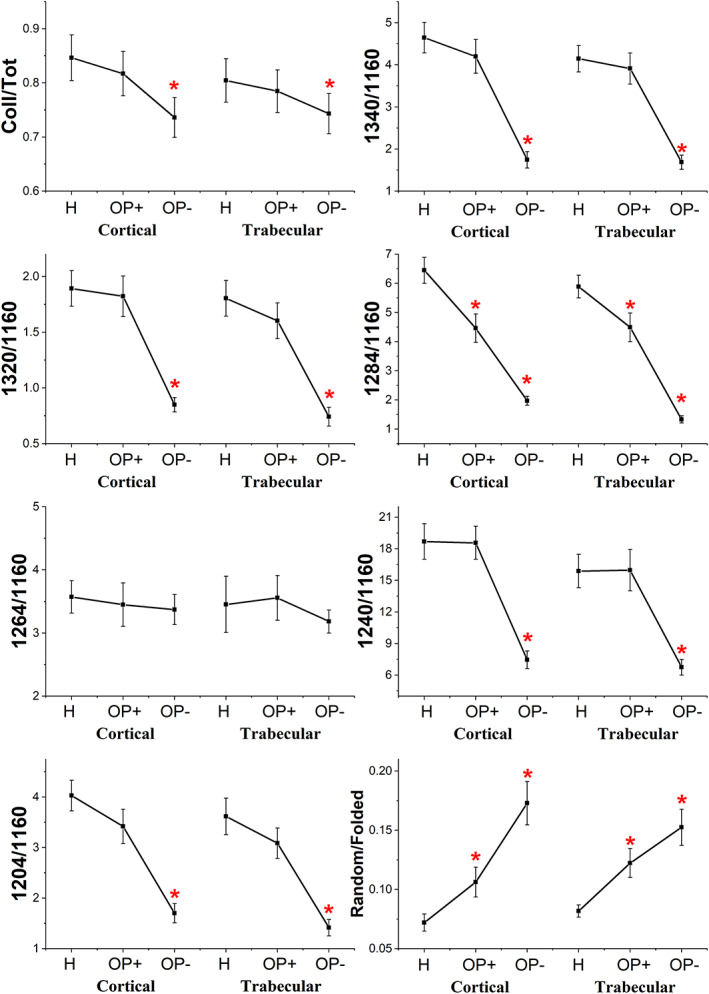
Statistical analysis of the following band area ratios calculated for H, OP+, and OP– spectra in cortical and trabecular regions: Coll/tot, 1340/1160, 1320/1160, 1284/1160, 1264/1160, 1240/1160, 1024/1160, and random/folded. Data are presented as mean ± SD red asterisks indicate statistically significant differences (p < 0.05; one‐way ANOVA and Tukey's multiple comparison test)