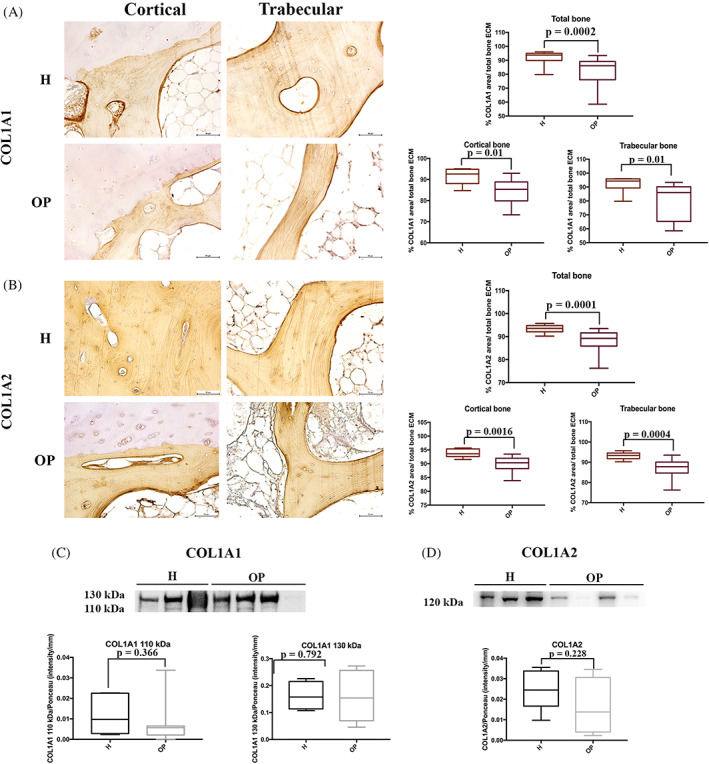
FIGURE 6.

Expression of type I collagen chains (COL1A1 and COL1A2) in healthy (H) and osteoporotic (OP) tissues. (A) Immunohistochemical staining images (×20 magnification, 50 μm scale bar) and semi‐quantification of COL1A1; (B) immunohistochemical staining images (×20 magnification, 50 μm scale bar) and semi‐quantification of COL1A2; (C) representative Western blotting image and densitometry for COL1A1; (D) representative Western blotting image and densitometry for COL1A2
