FIGURE 4.

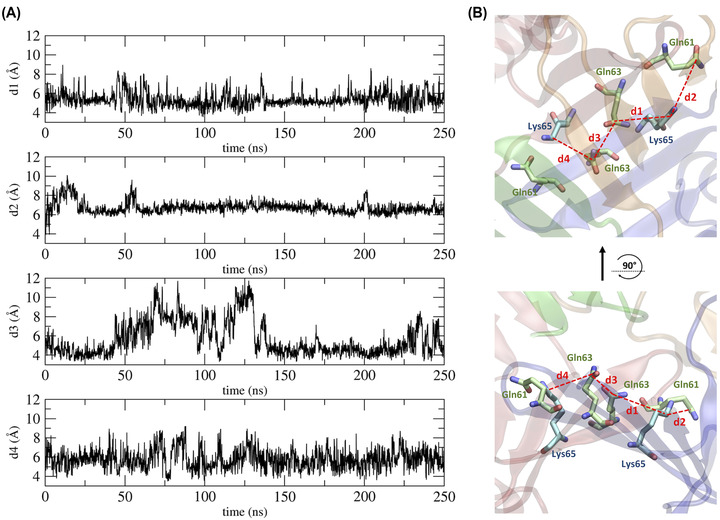
Distances between residues in the central region of the Pore I model. (A) Time evolution of distances between the amide C‐atom of the Gln residues and the amino C‐atom of the Lys residues. (B) 3D representation of the computed distances.

Distances between residues in the central region of the Pore I model. (A) Time evolution of distances between the amide C‐atom of the Gln residues and the amino C‐atom of the Lys residues. (B) 3D representation of the computed distances.