
FIGURE 6.
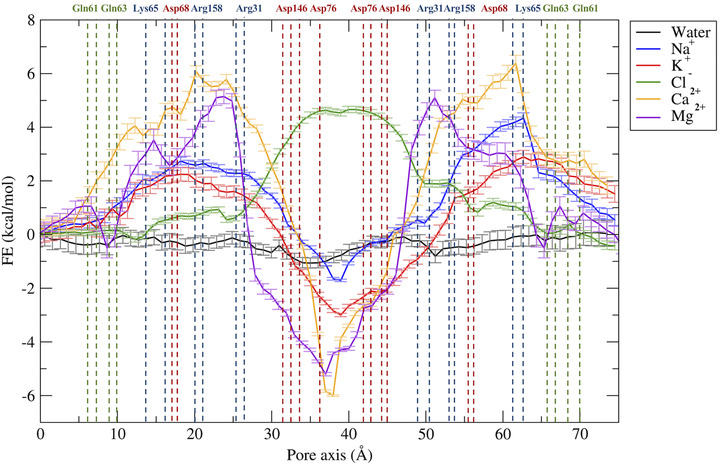
Free energy profiles for the permeation of water and ions through the Pore II model. The position of pore‐lining residues along the pore axis coordinate is indicated as dashed vertical lines. Acidic residues are colored in red, basic residues in blue, and neutral residues in green.