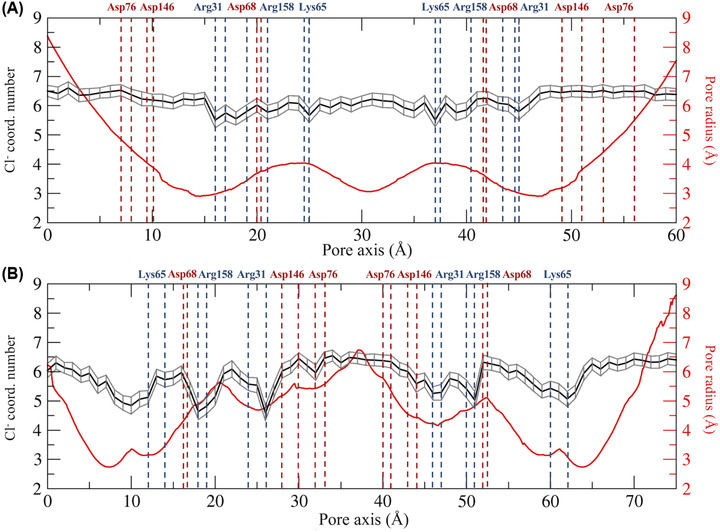
FIGURE 7.

Hydration patterns of chloride and pore radius profile for the Pore I (A) and the Pore II (B) models. The position of the pore‐lining residues driving the ion selectivity is indicated. Acidic residues are shown in red and basic residues in blue.
