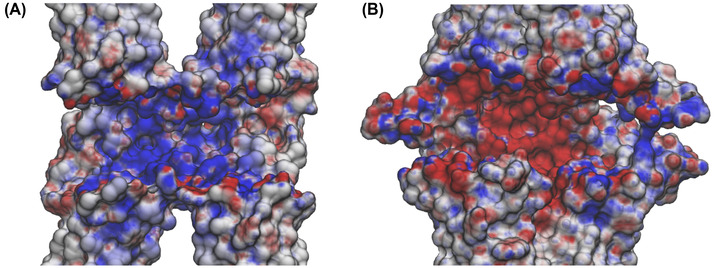
FIGURE 8.

Electrostatic surface of the claudin 4 tetrameric models. Cross sections of the Pore I (A) and Pore II (B) electrostatic surfaces in the paracellular region computed with the adaptive Poisson–Boltzmann solver (APBS). Potentials are shown with a red‐white‐blue color map with values ranging from −5 to +5 kT/e.
