FIGURE 2.

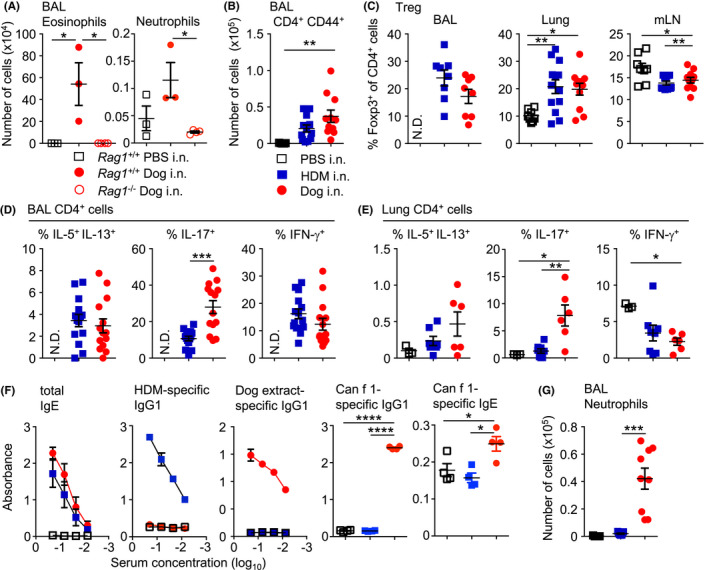
Intranasal administration of dog allergen extracts induces differentiation of both TH2 and TH17 cells. (A) PBS (open square), HDM (blue square) or dog allergen extracts (red circle) were administered to C57Bl6/J mice and the number of eosinophils and neutrophils was quantified (C57Bl6/J PBS n = 3, C57Bl6/J dog n = 3, Rag1 −/− dog n = 4). (B) Number of CD4+ CD44+ cells in the BAL (PBS n = 5, HDM = 12, dog allergen extracts n = 11). (C) Graphs of frequency of Foxp3+ cells among total CD4+ cells from the BAL, lung and mLN (BAL: HDM = 8, dog allergen extracts n = 8; lung and mLN PBS n = 8, HDM = 13, dog allergen extracts n = 11). (D) Graphs of the frequency of IL‐5+ IL‐13+, IL‐17+ and IFN‐γ+ cells among total CD4+ cells from the BAL (HDM = 14, dog allergen extracts n = 14). (E) Graphs of the frequency of IL‐5+ IL‐13+, IL‐17+ and IFN‐γ+ cells among total CD4+ cells from the lung (PBS n = 3, HDM = 8, dog allergen extracts n = 6). (F) ELISAs were performed on the serum of mice. Dog allergen‐specific and HDM‐specific IgG1 and total IgE graphs are the representative of 3 experiments (PBS n = 3, HDM = 5, dog allergen extracts n = 3). Can f 1‐specific IgG1 and IgE was also tested at a 1:3 dilution (PBS n = 4, HDM = 4, dog allergen extracts n = 4). (G) Regimen of intranasal administration with one additional challenge on day fifteen, three hours before harvesting organs, number of neutrophils from the BAL (PBS n = 5, HDM = 9, dog allergen extracts n = 9). N.D. Denotes not determined due to low cell numbers. One‐way ANOVA with Bonferroni's post‐test was performed except to compare frequencies of cytokine+ cells in the airways, where Mann–Whitney U test was used *p < .05, p < .01, ***p < .001, ****p < .0001
