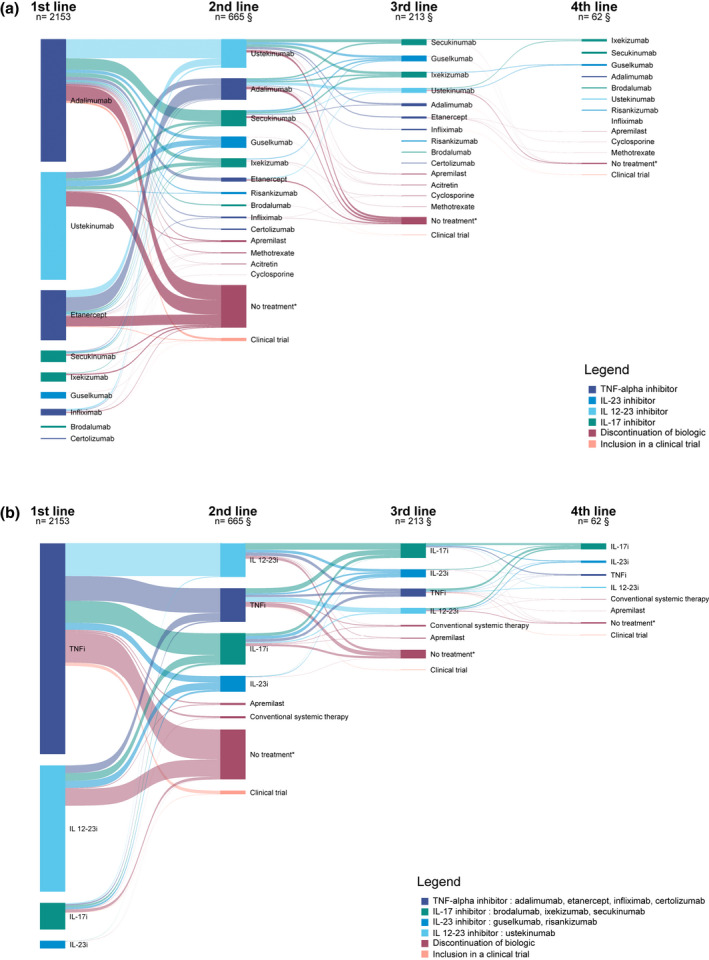
Figure 2.

(a) Sankey diagram of switches from a biologic and treatment discontinuation. *No other systemic treatment for 180 days or more. §Number of patients having switched to a biologic. Does not include patients who discontinued their biologic or participated in a clinical trial. Only switches occurring at a frequency of three or more were represented to better visualize the most common switches. Each column represents a biological line of treatment. Treatments are ordered according to frequency, the uppermost biologic in each line of treatment being the most frequent. Following lines of treatment once patients had discontinued their treatment or had been included in a clinical trial were not represented. Tables providing corresponding numbers and percentages are available in the supplementary material (Tables S1–S3). (b) Sankey diagram of switches from a biologic and treatment discontinuation by biologic drug class. *No other systemic treatment for 180 days or more. §Number of patients having switched to a biologic. Does not include patients who discontinued their biologic or participated in a clinical trial. Treatments are ordered according to frequency, the uppermost biologic in each line of treatment being the most frequent. Following lines of treatment once patients had discontinued their treatment or had been included in a clinical trial were not represented. [Colour figure can be viewed at wileyonlinelibrary.com]
