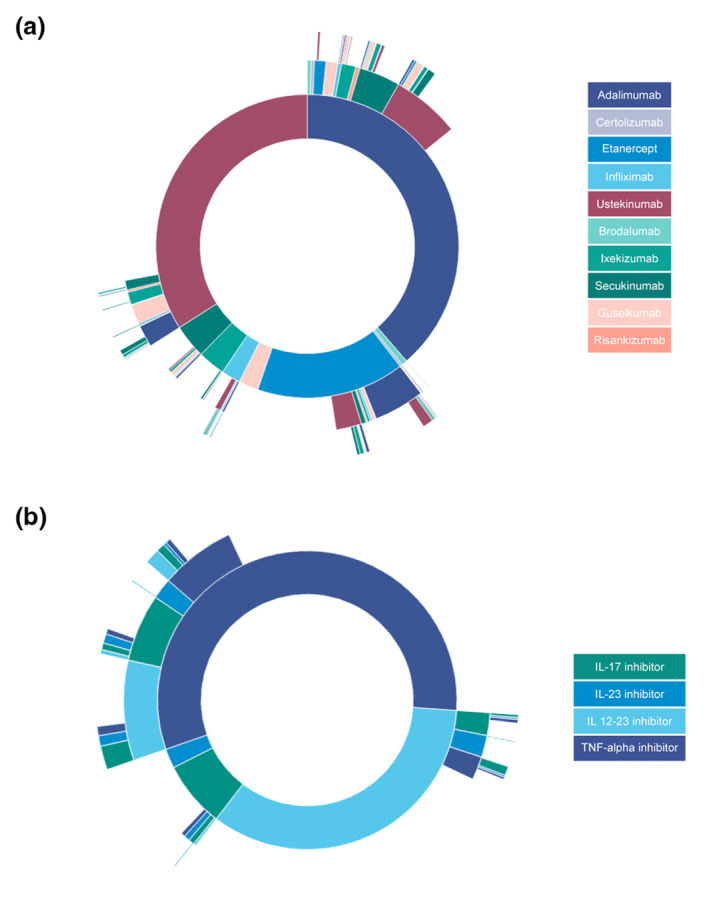
Figure 4.

(a) Sunburst diagram of biologic switches by biologic agent. Each circle represents a line of treatment, the inner circle being the first line. (b) Sunburst diagram of biologic switches by biologic drug class. Each circle represents a line of treatment, the inner circle being the first line. [Colour figure can be viewed at wileyonlinelibrary.com]
