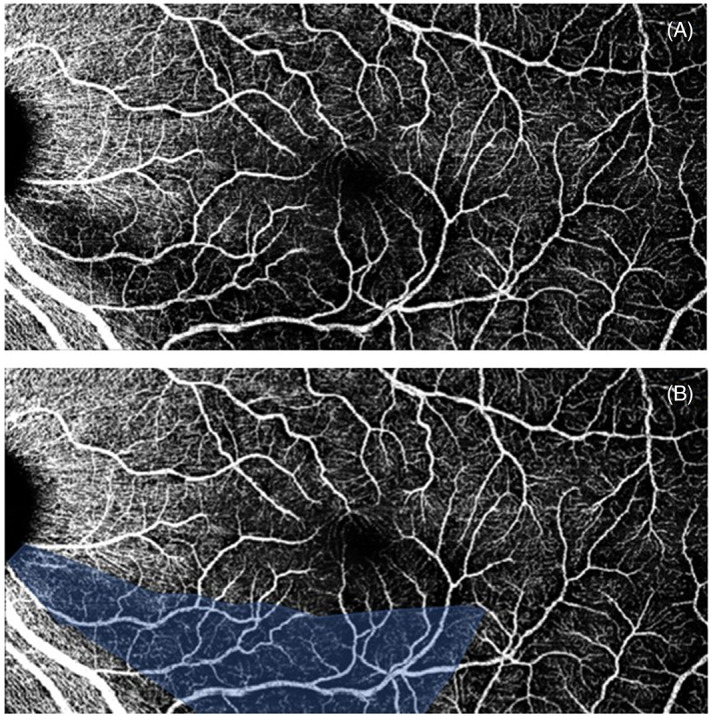
FIGURE 1.

An example of a vascular wedge defect. (A) Indicates the raw export from the Spectralis optical coherence tomography angiography (OCTA) system and (B) indicates the vascular wedge, outlined in ImageJ software. This overlay is used to calculate area of the wedge and for demonstration purposes. Image is binarized to calculate vessel density within the shaded area
