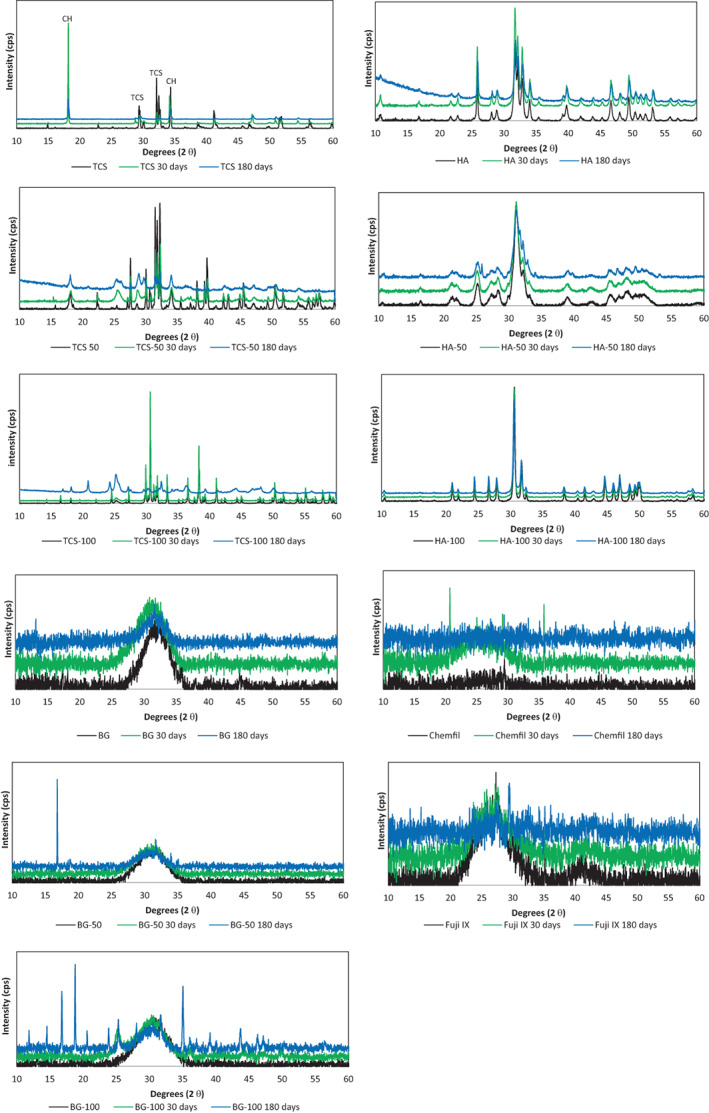
FIGURE 3.

X‐ray diffraction plots of test materials and strontium doped versions showing the main phases present. The TCS variants exhibited phase changes throughout the 180 days while HA was stable. The BG exhibited some crystalline changes which were more marked in the BG‐100 after 180 days. CH, calcium hydroxide; TCS, tricalcium silicate; (n = 3)
