
FIGURE 2.
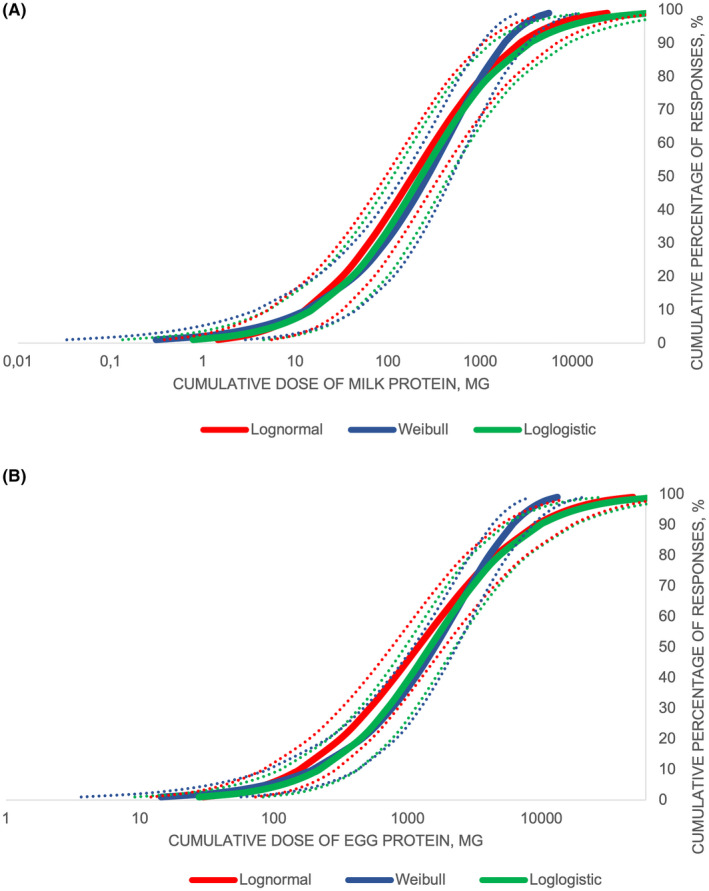
Probability distribution curves of thresholds for cow's milk (A) and hen's egg (B) based on Log‐normal, Log‐logistic, and Weibull distribution models. The dashed lines indicate the 95% confidence interval
Official websites use .gov
A
.gov website belongs to an official
government organization in the United States.
Secure .gov websites use HTTPS
A lock (
) or https:// means you've safely
connected to the .gov website. Share sensitive
information only on official, secure websites.
Probability distribution curves of thresholds for cow's milk (A) and hen's egg (B) based on Log‐normal, Log‐logistic, and Weibull distribution models. The dashed lines indicate the 95% confidence interval