
FIGURE 1.
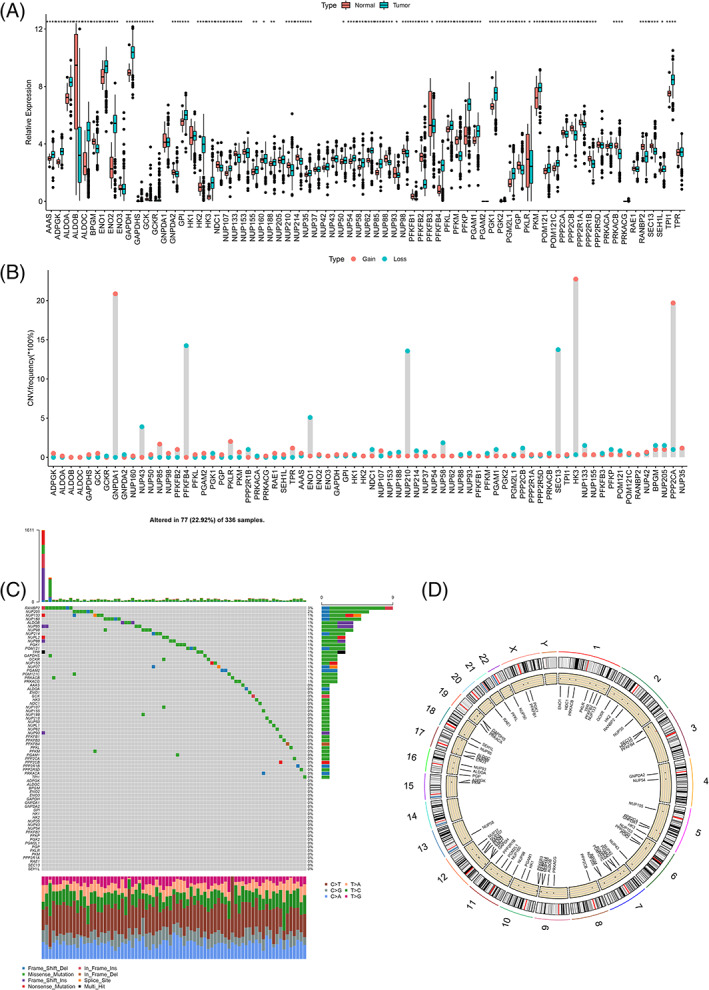
The overall display of glycolytic genes using the cancer genome atlas (TCGA) data. (A) Differential expression of 72 glycolytic genes in unscreened the cancer genome atlas‐kidney renal clear cell carcinoma (TCGA‐KIRC) tumor tissues and normal tissues. (B) Copy number variations (CNV) variation frequency of 536 samples of 72 glycolytic genes. (C) The spectrum of TCGA‐KIRC somatic mutation. (D) The genomic locations of 72 glycolytic genes [Color figure can be viewed at wileyonlinelibrary.com]