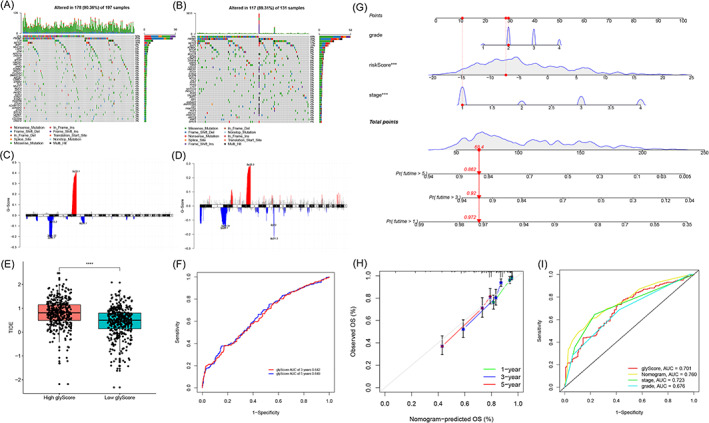
FIGURE 5.

Landscape of High and Low glycolysis‐score groups and predictive ability of immune checkpoint blockade (ICB) response of the glyScore. (A) The spectrum of somatic mutations in the Low glyScore group. (B) The spectrum of somatic mutations in the High glyScore group. (C) Copy number variations (CNV) peak in the Low glyScore group. (D) CNV peak in the High glyScore group. (E) The difference of TIDE prediction scores between the glyScore groups. (F) The receiver operating characteristic (ROC) curve for glyScore's 5‐year survival. (G) Glycolysis‐related nomogram. (H) Calibration of the nomogram. (I) ROC curves of nomogram, glyScore, stage and grade (prediction time = 5 years) [Color figure can be viewed at wileyonlinelibrary.com]
