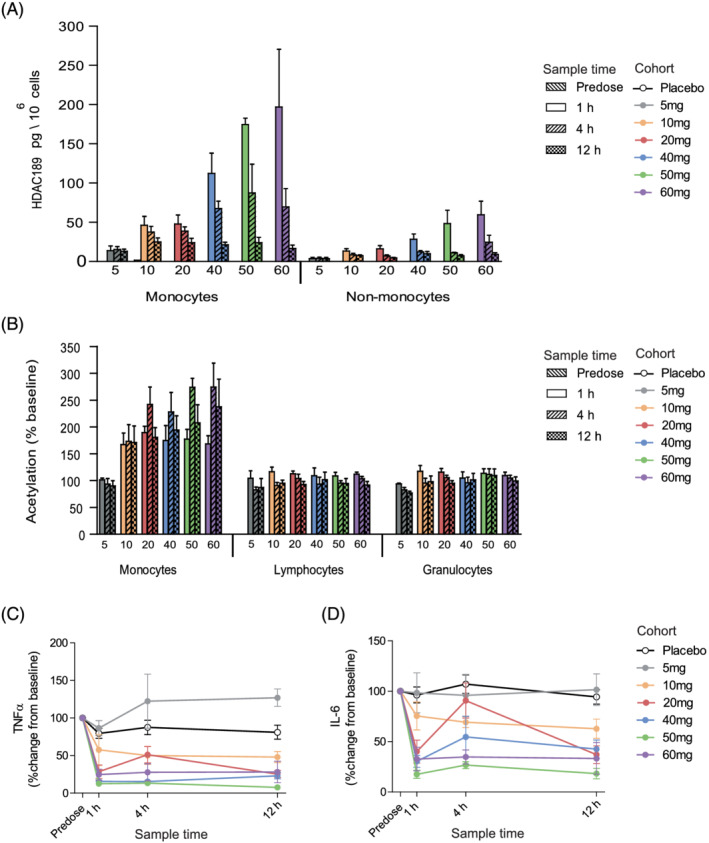
FIGURE 3.

Part A, single‐ascending dose, clinical characterisation of ESM‐HDAC391. (A) Quantification of HDAC189 levels in monocyte and non‐monocyte fractions per dose cohort. (B) Acetylation levels in gated monocyte, lymphocyte and granulocyte populations for each assessed timepoint and dose cohort. (C, D) Time course of inhibition of ex vivo lipopolysaccharide‐stimulated cytokine production (tumour necrosis factor [TNF]α and interleukin [IL]‐6, respectively) per dose cohort. Data are shown as mean and standard error. n = 6 for all treatment cohorts with the exception of 5 mg and 50 mg, where n = 4. For panels C and D, n = 12 placebos from all cohorts were included
