
FIGURE 6.
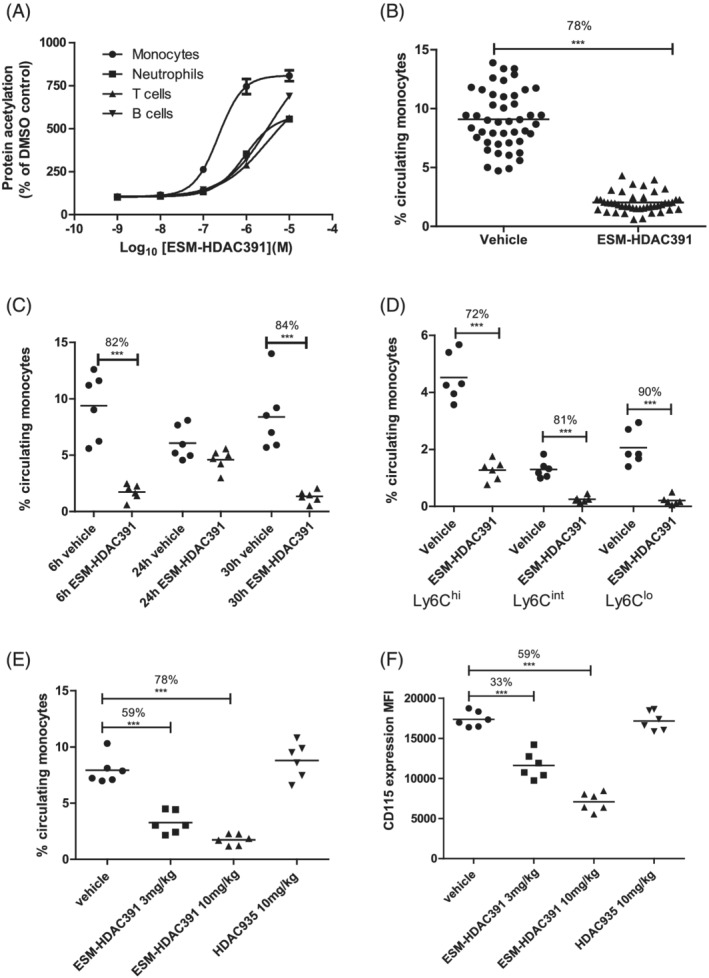
Demonstration of monocytopaenia in CES1/Es1e lo mice. (A) Acetylation of leucocyte populations in mouse whole blood following 3 hours incubation with ESM‐HDAC391 (n = 6). (B) Reduction in total circulating monocyte population 6 hours after intraperitoneal (ip) dosing of CES1/Es1e lo mice with 10 mg/mL ESM‐HDAC391 (n = 46) compared to vehicle controls (n = 45); data pooled across 8 in vivo studies. (C) Time course of reduction in total circulating monocytes in CES1/Es1e lo mice either 6 or 24 hours after a single dose, or 6 hours after a second dose at 24 hours, of 10 mg/mL ESM‐HDAC391 vs. vehicle (ip), all compared with time‐matched vehicle controls; n = 6 mice per group. (D) Analysis of monocyte sub‐populations (Ly6Chi, Ly6Clo and Ly6Cint) 6 hours after dosing CES1/Es1e lo mice with 10 mg/mL ESM‐HDAC391 compared with vehicle controls (n = 6). (E) Reduction in total circulating monocyte population 6 hours after dosing CES1/Es1e lo mice with 3 or 10 mg/mL ESM‐HDAC391 vs. vehicle (ip) compared with 10 mg/kg HDAC935 and matched vehicle controls (n = 6). (F) Levels of CD115 (measured as median fluorescence intensity) on monocyte populations in panel (E). Statistical analysis was carried out by an unpaired, 2‐tailed t‐test (B) or a 1‐way ANOVA with Bonferroni post‐test (C–F)