
FIGURE 6.
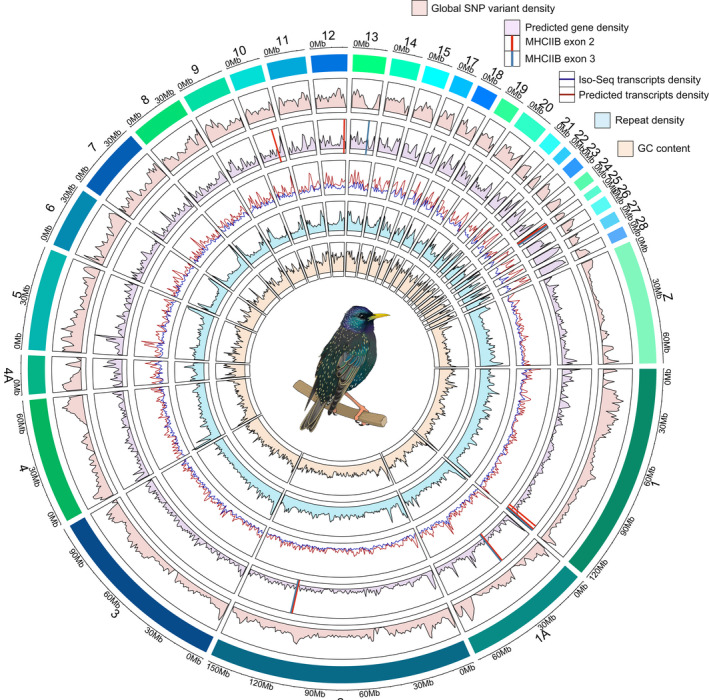
CIRCLIZE plot of the 32 main super‐scaffolds (32 putative autosome chromosomes) in the Sturnus vulgaris (S. vulgaris vAU) genome assembly (>98% of the total assembly length). The tracks denote variable values in 1,000,000 bp sliding windows. From the outermost track in, the variables displayed are track 1 (variant density, red area), track 2 (final annotation gene density, purple area; MHCIIB exon 2, red line; MHCIIB exon 3, blue line), track 3 (Iso‐Seq transcripts, blue line; final annotation transcripts, red line), and track 4 (repeat density, blue area), track 5 (GC content, yellow area). Of the 16 MHCIIB exon 2 and exon 3 hits on the final S. vulgaris vAU1.0, a total of 7 and 5 for exons 2 and 3 respectively were located on the main super‐scaffolds, with the remaining hits being located on unplaced scaffolds not graphed here