
Figure 2.
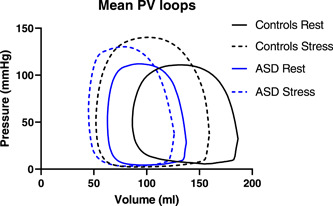
Mean pressure–volume loops for controls (black) and patients with atrial septal defect (ASD) (blue) at rest (solid line) and stress (broken line).
Official websites use .gov
A
.gov website belongs to an official
government organization in the United States.
Secure .gov websites use HTTPS
A lock (
) or https:// means you've safely
connected to the .gov website. Share sensitive
information only on official, secure websites.
Mean pressure–volume loops for controls (black) and patients with atrial septal defect (ASD) (blue) at rest (solid line) and stress (broken line).