FIG 1.

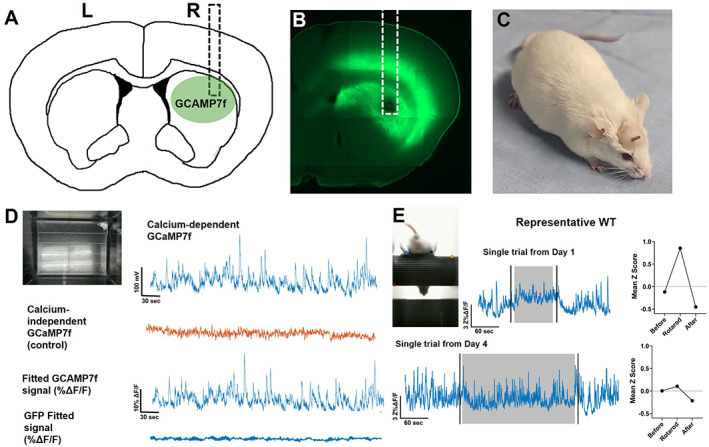
Characterization of the striatal jGCaMP7f signal. (A) Cartoon showing the approximate location of the jGCaMP7f injection and fiber‐optic cannula implant (dotted line) in the dorsal striatum. (B) Brain slice with jGCaMP7f expression and fiber tract from an experimental animal. (C) FVB/N mouse with a fiber‐optic cannula implanted in the dorsal striatum. Dental cement is used to adhere the fiber to the skull. (D) Example fiber photometry signal from WT mouse during open‐field exploration. Top left: Image of mouse in the open field. Top right: Raw jGCaMP7f signal excited at 465 nm to detect calcium‐dependent signals. Second row: Raw isosbestic control signals excited at 405 nm to detect calcium‐independent signals. Third row: Fitted jGCaMP7f signal showing percentage change in fluorescence. Bottom row: Fitted GFP signal (negative control) showing percentage change in fluorescence. (E) Example WT fiber photometry signal during rotarod. Top left: Image of mouse performing the rotarod task. Top middle: Example jGCaMP7f change in fluorescence from a trial on day 1. Black vertical lines denote when mouse is picked up from and returned to empty cage before and after trial. Gray area represents when mouse is on the accelerating rotarod. Top right: Quantification of mean jGCaMP7f data during phases of the trial. Bottom: Example jGCaMP7f change in fluorescence from a trial on day 4 and the quantification of this data during phases of trial. L, left; R, right; WT, wild type. [Color figure can be viewed at wileyonlinelibrary.com]
