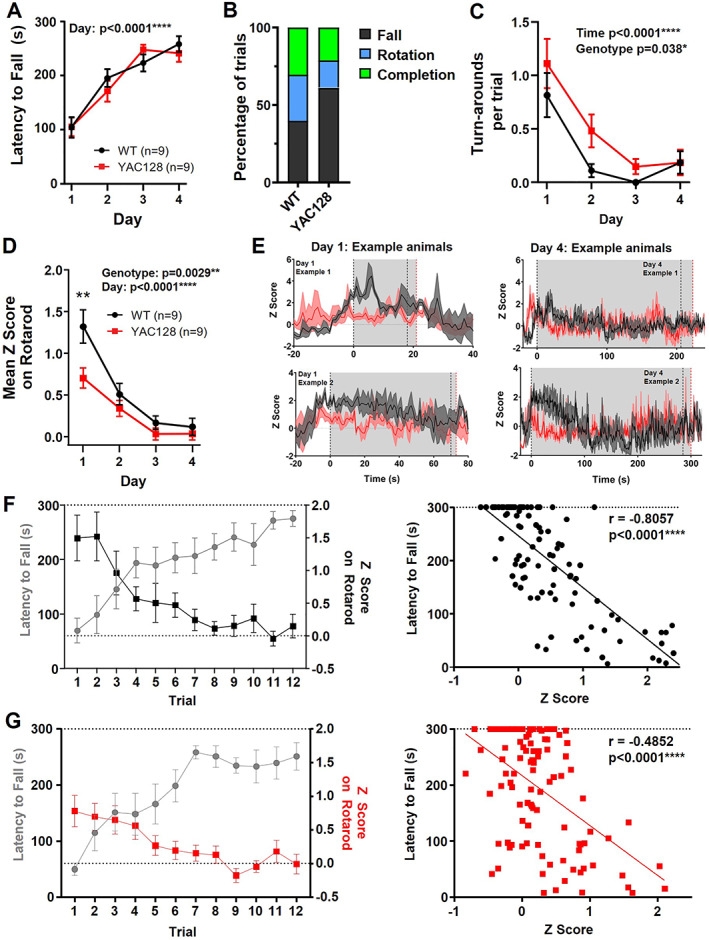
FIG 2.

Changes to rotarod performance and striatal activity on the rotarod in premanifest YAC128 mice. (A) Latency to fall over days of training (three trials averaged per day) (day effect, P < 0.0001; two‐way analysis of variance [ANOVA]). (B) Percentage of trials that ended by falling, rotating, or completing full trial. (C) Mean number of turnarounds per trial over days of training (day effect, P < 0.0001; genotype effect, P = 0.0038; two‐way ANOVA). (D) Mean z score on rotarod over days of training (day effect, P < 0.0001; genotype effect, P = 0.0029; and genotype difference on day 1, P = 0.0010; two‐way ANOVA with multiple comparisons). (E) jGCaMP7f traces from two example animals of each genotype. Each trace is the average of three trials for day 1 (left) and day 4 (right). Gray area denotes average latency to fall that day for WT (black dotted line) and YAC128 (red dotted line). (F–G) Left: Latency to fall plotted against mean z score per trial for WT (F) and YAC128 (G). Right: Scatterplot of latency to fall compared with z score for each trial (WT, Pearson's r = −0.8057, P < 0.0001; YAC128 Pearson's r = −0.4852, P < 0.0001). WT, wild type; YAC128, yeast artificial chromsome‐128CAG. [Color figure can be viewed at wileyonlinelibrary.com]
