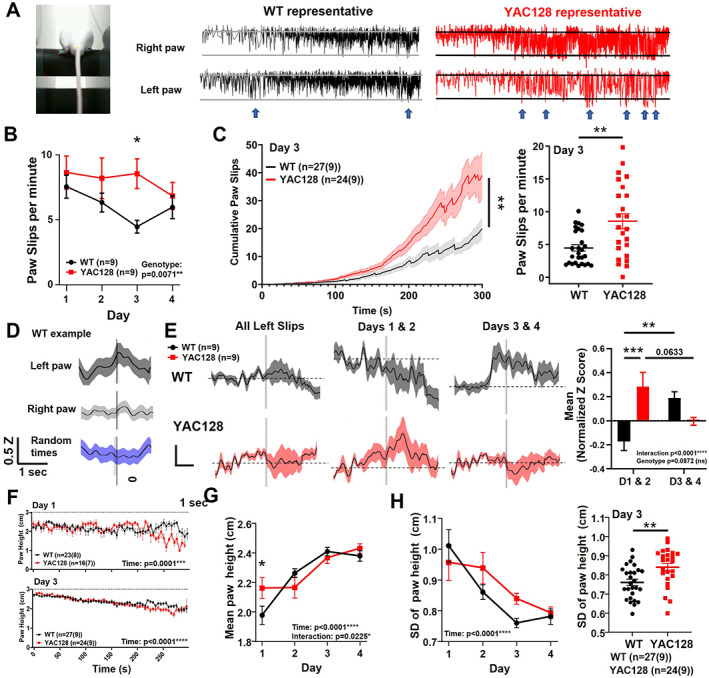
FIG 3.

Paw kinematics and striatal activity during paw slips in premanifest YAC128 mice. (A) Mouse on rotarod with labeled hindpaws, and WT and YAC128 representative examples of vertical paw position over time. Blue arrows indicate some paw slips. (B) Paw slips per minute over days of training (genotype effect, P = 0.0071; genotype difference on day 3, P = 0.0114; denoted by *; two‐way analysis of variance [ANOVA] multiple comparisons). (C) Left: Cumulative paw slips over time during rotarod trials on day 3 (mixed‐effects analysis, genotype, P = 0.0073; time, P < 0.0001; denoted by **). Three YAC128 trials were excluded because of missing or disrupted video data. Right: Day 3 mean paw slips/trial (unpaired t test, P = 0.0013). (D) Example of normalized jGCaMP7f z score data from WT animal for all paw slips on rotarod. The z score (Z) is normalized by subtracting baseline period (Z0) of 3 to 1 second before the paw slips (Z − Z0). Vertical line represents paw slip or random time that data were aligned with. (E) Left: Normalized z score was calculated for each animal and averaged per genotype. Middle left: Normalized z score for paw slips on days 1 and 2. Two YAC128 animals were excluded because of insufficient number of paw slips (<3 paw slips total for days 1 and 2 combined). Middle right: Normalized z score for paw slips on days 3 and 4. Right: Mean normalized z score from −1 to +3 second time points around paw slips (interaction, P = 0.0001; genotype, P = 0.0872; genotype comparison on days 1/2, P = 0.0009; denoted by ***; WT days comparison, P = 0.0079; denoted by **; YAC128 days comparison, P = 0.0633). (F) Paw height (both paws) over trial duration for day 1 (top) and day 4 (bottom; number of trials shown with number of animals in brackets; time effect, P < 0.0001; two‐way ANOVA). (G) Mean paw height over days of training (time effect, P < 0.0001; interaction, P = 0.0225; genotype day 1, P = 0.0461). (H) Left: Standard deviation of paw height over days of training (time effect, P < 0.0001). Right: Standard deviation of paw height per trial (both paws averaged) on day 3 (P = 0.0037, denoted by **, unpaired t test). ns, nonsignificant; WT, wild type; YAC128, yeast artificial chromsome‐128CAG. [Color figure can be viewed at wileyonlinelibrary.com]
