FIG 5.

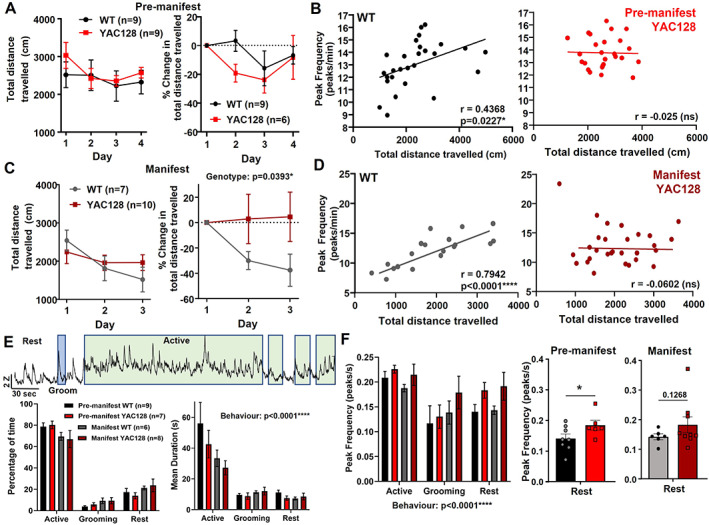
Behavior and striatal activity during open field in WT and YAC128 mice. (A) Total distance traveled (left) and change in distance traveled from day 1 (right) in premanifest YAC128 and their WT littermates. Three premanifest YAC128 mice were excluded from change in total distance analysis because of missing or disrupted behavior videos on day 1. (B) Scatterplots of calcium peak frequency and total distance traveled for each open‐field trial in WT (left, r = 0.4368, P = 0.0227) and YAC128 (right, no significant correlation). Of the WT trials, 25% (nine) and 27% (10) of YAC128 trials were excluded from correlation analysis because of disruptions to behavior video data or photometry data. (C) Total distance traveled (left) and change in distance traveled from day 1 (right) in manifest YAC128 and their WT littermates. Significant genotype effect for change in distance traveled (P = 0.0393, two‐way analysis of variance). (D) Scatterplots of calcium peak frequency and total distance traveled for each open‐field trial in WT (left, r = 0.7942, P < 0.0001) and YAC128 (right, no significant correlation). Of the WT trials, 10% (two) and 3% (one) of YAC128 trials were excluded from correlation analysis because of disruptions to video data or photometry data. (E) Top: Example jGCaMP7f activity trace from an open‐field trial (2‐ to 3‐month‐old WT) showing periods of active behavior (green), grooming behavior (blue), and the other periods are rest behavior. Bottom left: Percentage of time spent in the active, grooming, or rest behavior for premanifest and manifest YAC128 and WT littermates (behavior, P < 0.0001). All groups showed a significantly higher percentage of time spent active compared with grooming or rest behavior (P < 0.0001 for comparisons between behaviors for all four groups). Bottom right: Average duration per bout of each behavior for premanifest and manifest YAC128 and WT littermates (behavior, P < 0.0001). All groups except manifest YAC128 showed a significantly higher bout duration for active versus grooming and rest behaviors (premanifest WT: P < 0.0001 active vs. rest and active vs. grooming; premanifest YAC128: P = 0.0004 active vs. grooming, P = 0.0002 active vs. rest; manifest WT: P = 0.0325 active vs. grooming, P = 0.0082 active vs. rest). (F) Left: Calcium peak frequency (per second) during different behaviors (behavior, P = 0.0003; genotype, P = 0.0818). Middle: Peak frequency at rest for premanifest YAC128 and WT (P = 0.0341, denoted by *, unpaired t test). Right: Peak frequency at rest for manifest YAC128 and WT (P = 0.1268, unpaired t test). ns, nonsignificant; WT, wild type; YAC128, yeast artificial chromsome‐128CAG. [Color figure can be viewed at wileyonlinelibrary.com]
