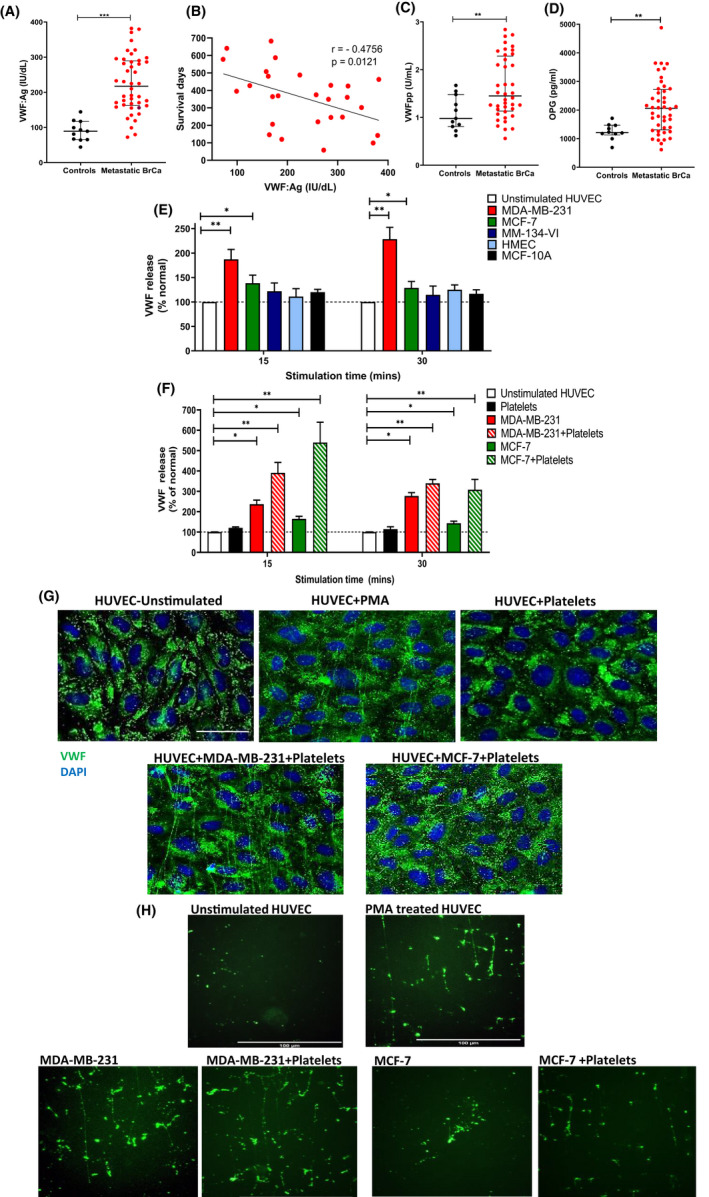
FIGURE 1.

Breast cancer cells promote VWF secretion from EC through platelet‐dependent and platelet‐independent pathways. (A) Plasma VWF:Ag levels were quantified in patients with advanced metastatic breast cancer and compared to sex‐matched healthy controls. Data are graphed as median and interquartile range. (B) Plasma VWF:Ag levels were correlated with patient survival over a 2‐year period. (C) Plasma VWFpp levels and (D) OPG levels were quantified in patients with advanced metastatic breast cancer and compared with sex‐matched healthy controls. Data are graphed as median and interquartile range. Patient data were analyzed with using the Mann–Whitney U test for unpaired two‐tailed t‐ test and p values < .05 were considered to be significant. (E) Breast tumor‐induced endothelial cell activation was assessed using specific VWF:Ag ELISA and percentage VWF release was calculated by comparing the VWF:Ag levels to unstimulated HUVEC controls. (F) Tumor cell supernatant from co‐culture of MDA‐MB‐231 or MCF‐7 with platelets was assessed for EC activating potential. (G) HUVEC stimulation by either MDA‐MB‐231+platelets, MCF‐7+platelets or PMA as a positive control was visualized by immunofluorescence VWF staining (green). Scale bar represents 50 μm. (H) HUVEC were perfused with supernatant from MDA‐MB‐231 or MCF‐7 cells alone or supernatant from breast tumor‐platelet co‐cultures. VWF staining was visualized by immunofluorescence VWF staining (green) under conditions of venous shear stress. Scale bar represents 100 μm. Data are presented as the mean ± SEM of at least three independent experiments. Data were analyzed with Student unpaired two‐tailed t‐ test versus control conditions and p values <.05 were considered to be significant (*p <0 .05, **p < .005, ***p < .001).
