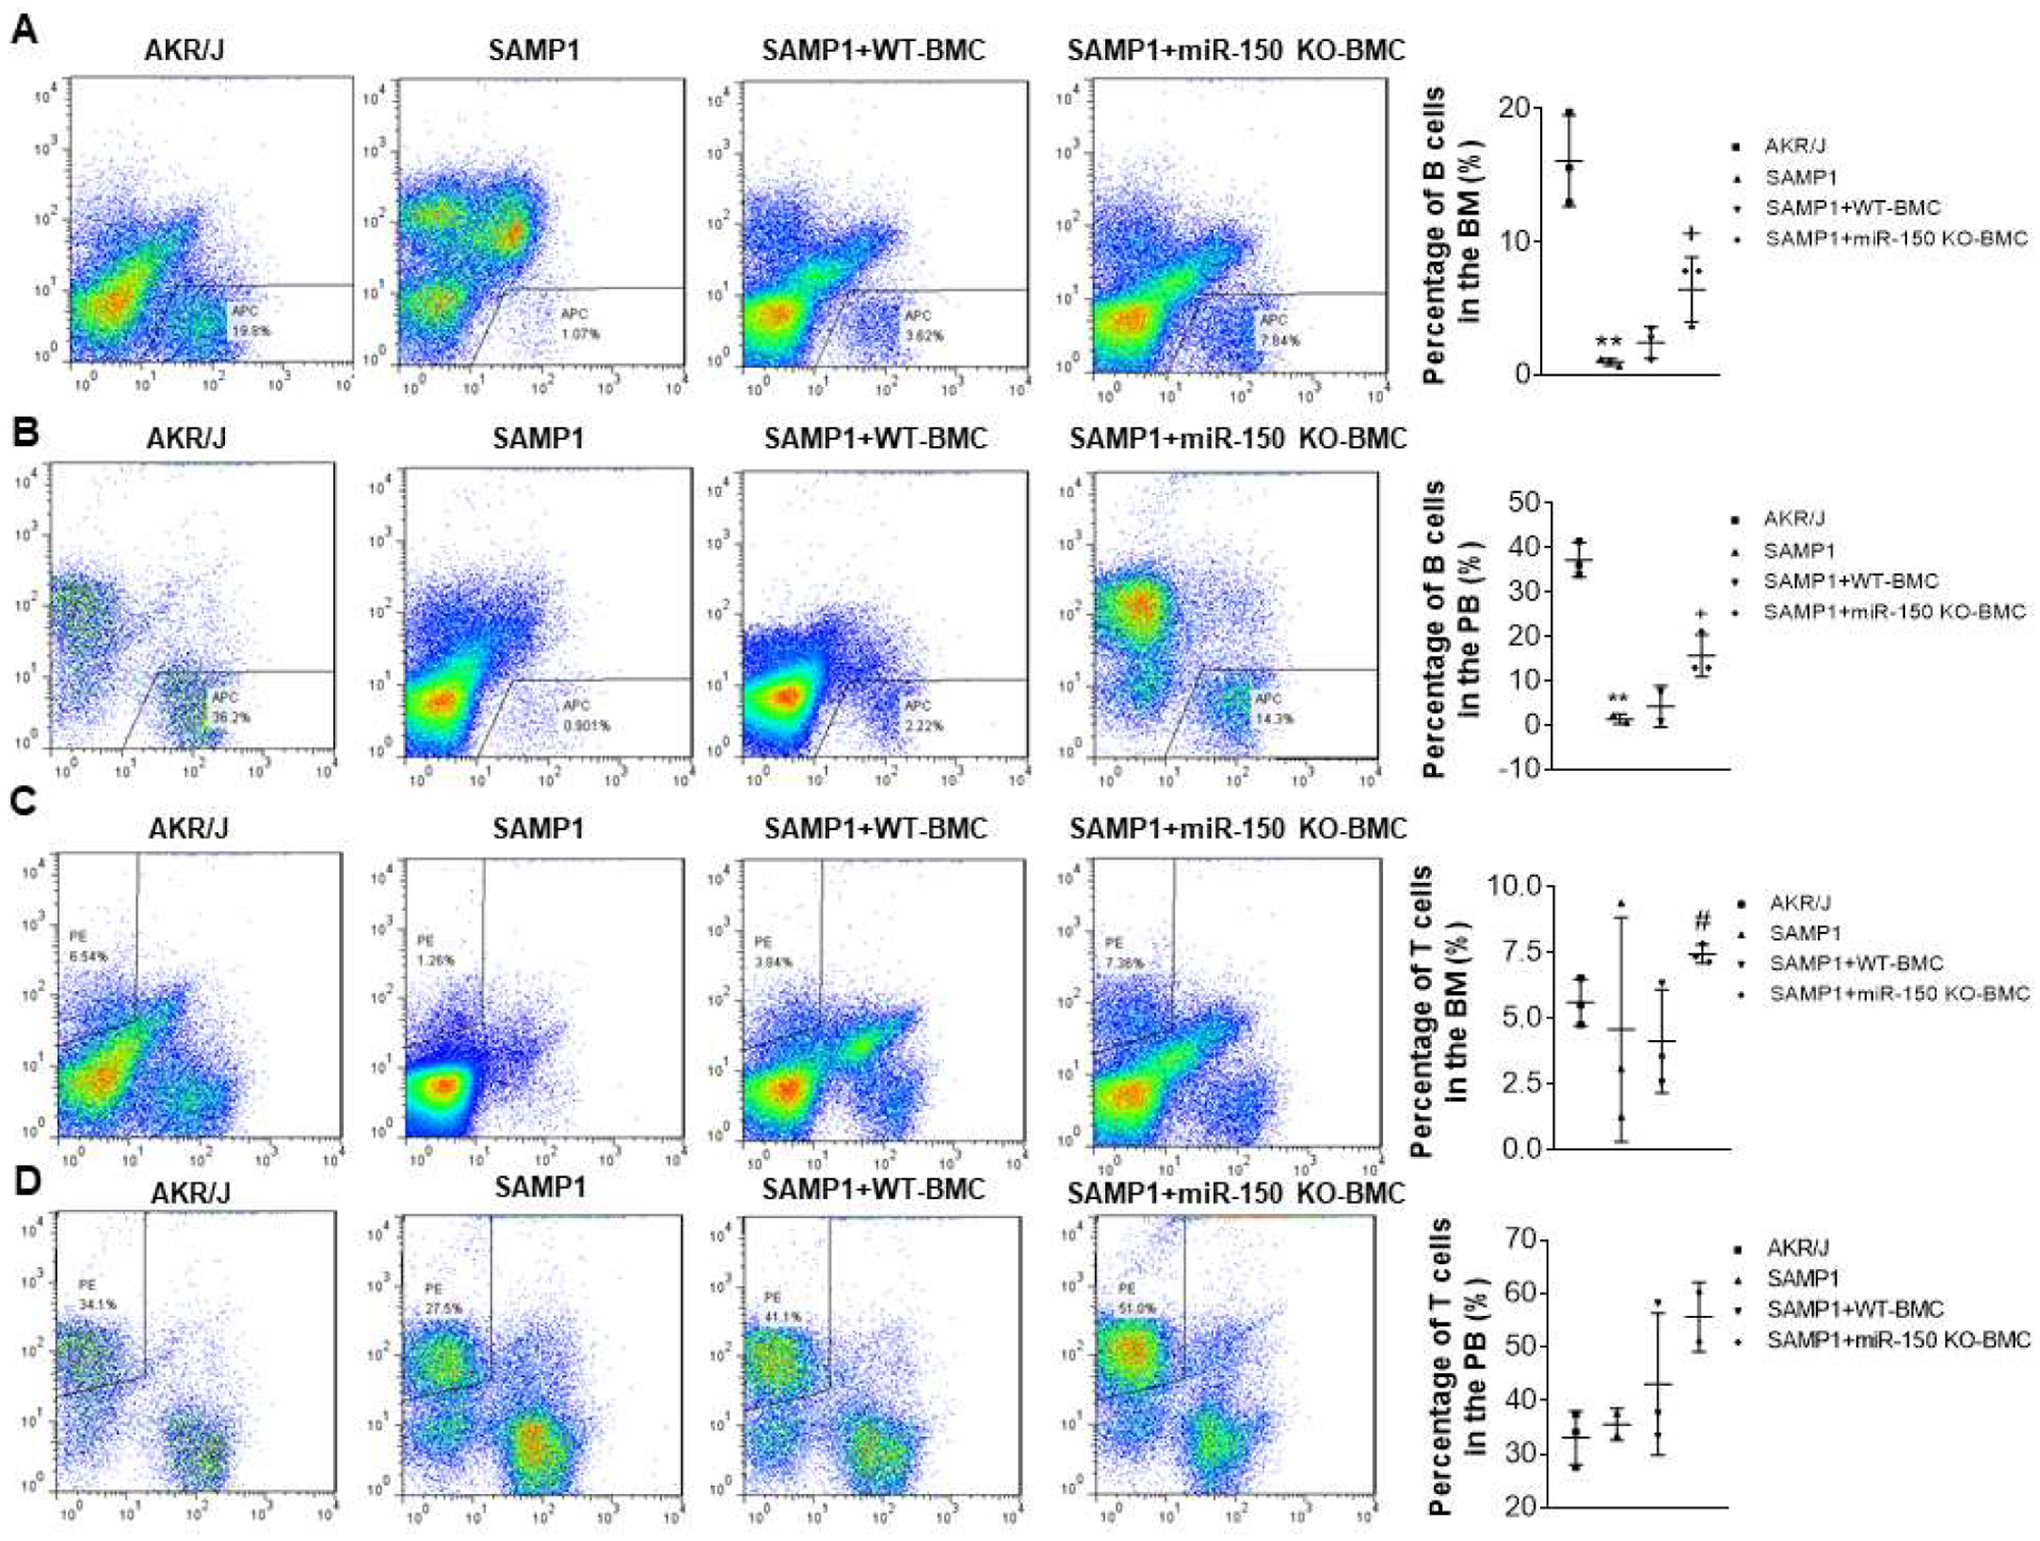
Figure 1.

Flowcytometry analysis of B cells and T cells percentage in the bone marrow (BM) and peripheral blood (PB). Representative B cell plots and B cell percentages in the BM (A) and PB (B). Representative T cell plots and T cell percentages in the BM (C) and PB (D). Data = mean ± SEM (n=3). The data were analyzed using one-way ANOVA analysis with Bonferroni correction. ** P<0.01 Vs AKR/J mice; + P<0.05, ++P<0.01 Vs SAMP1 mice; #P<0.05 Vs SAMP1+WT-BMC mice.
