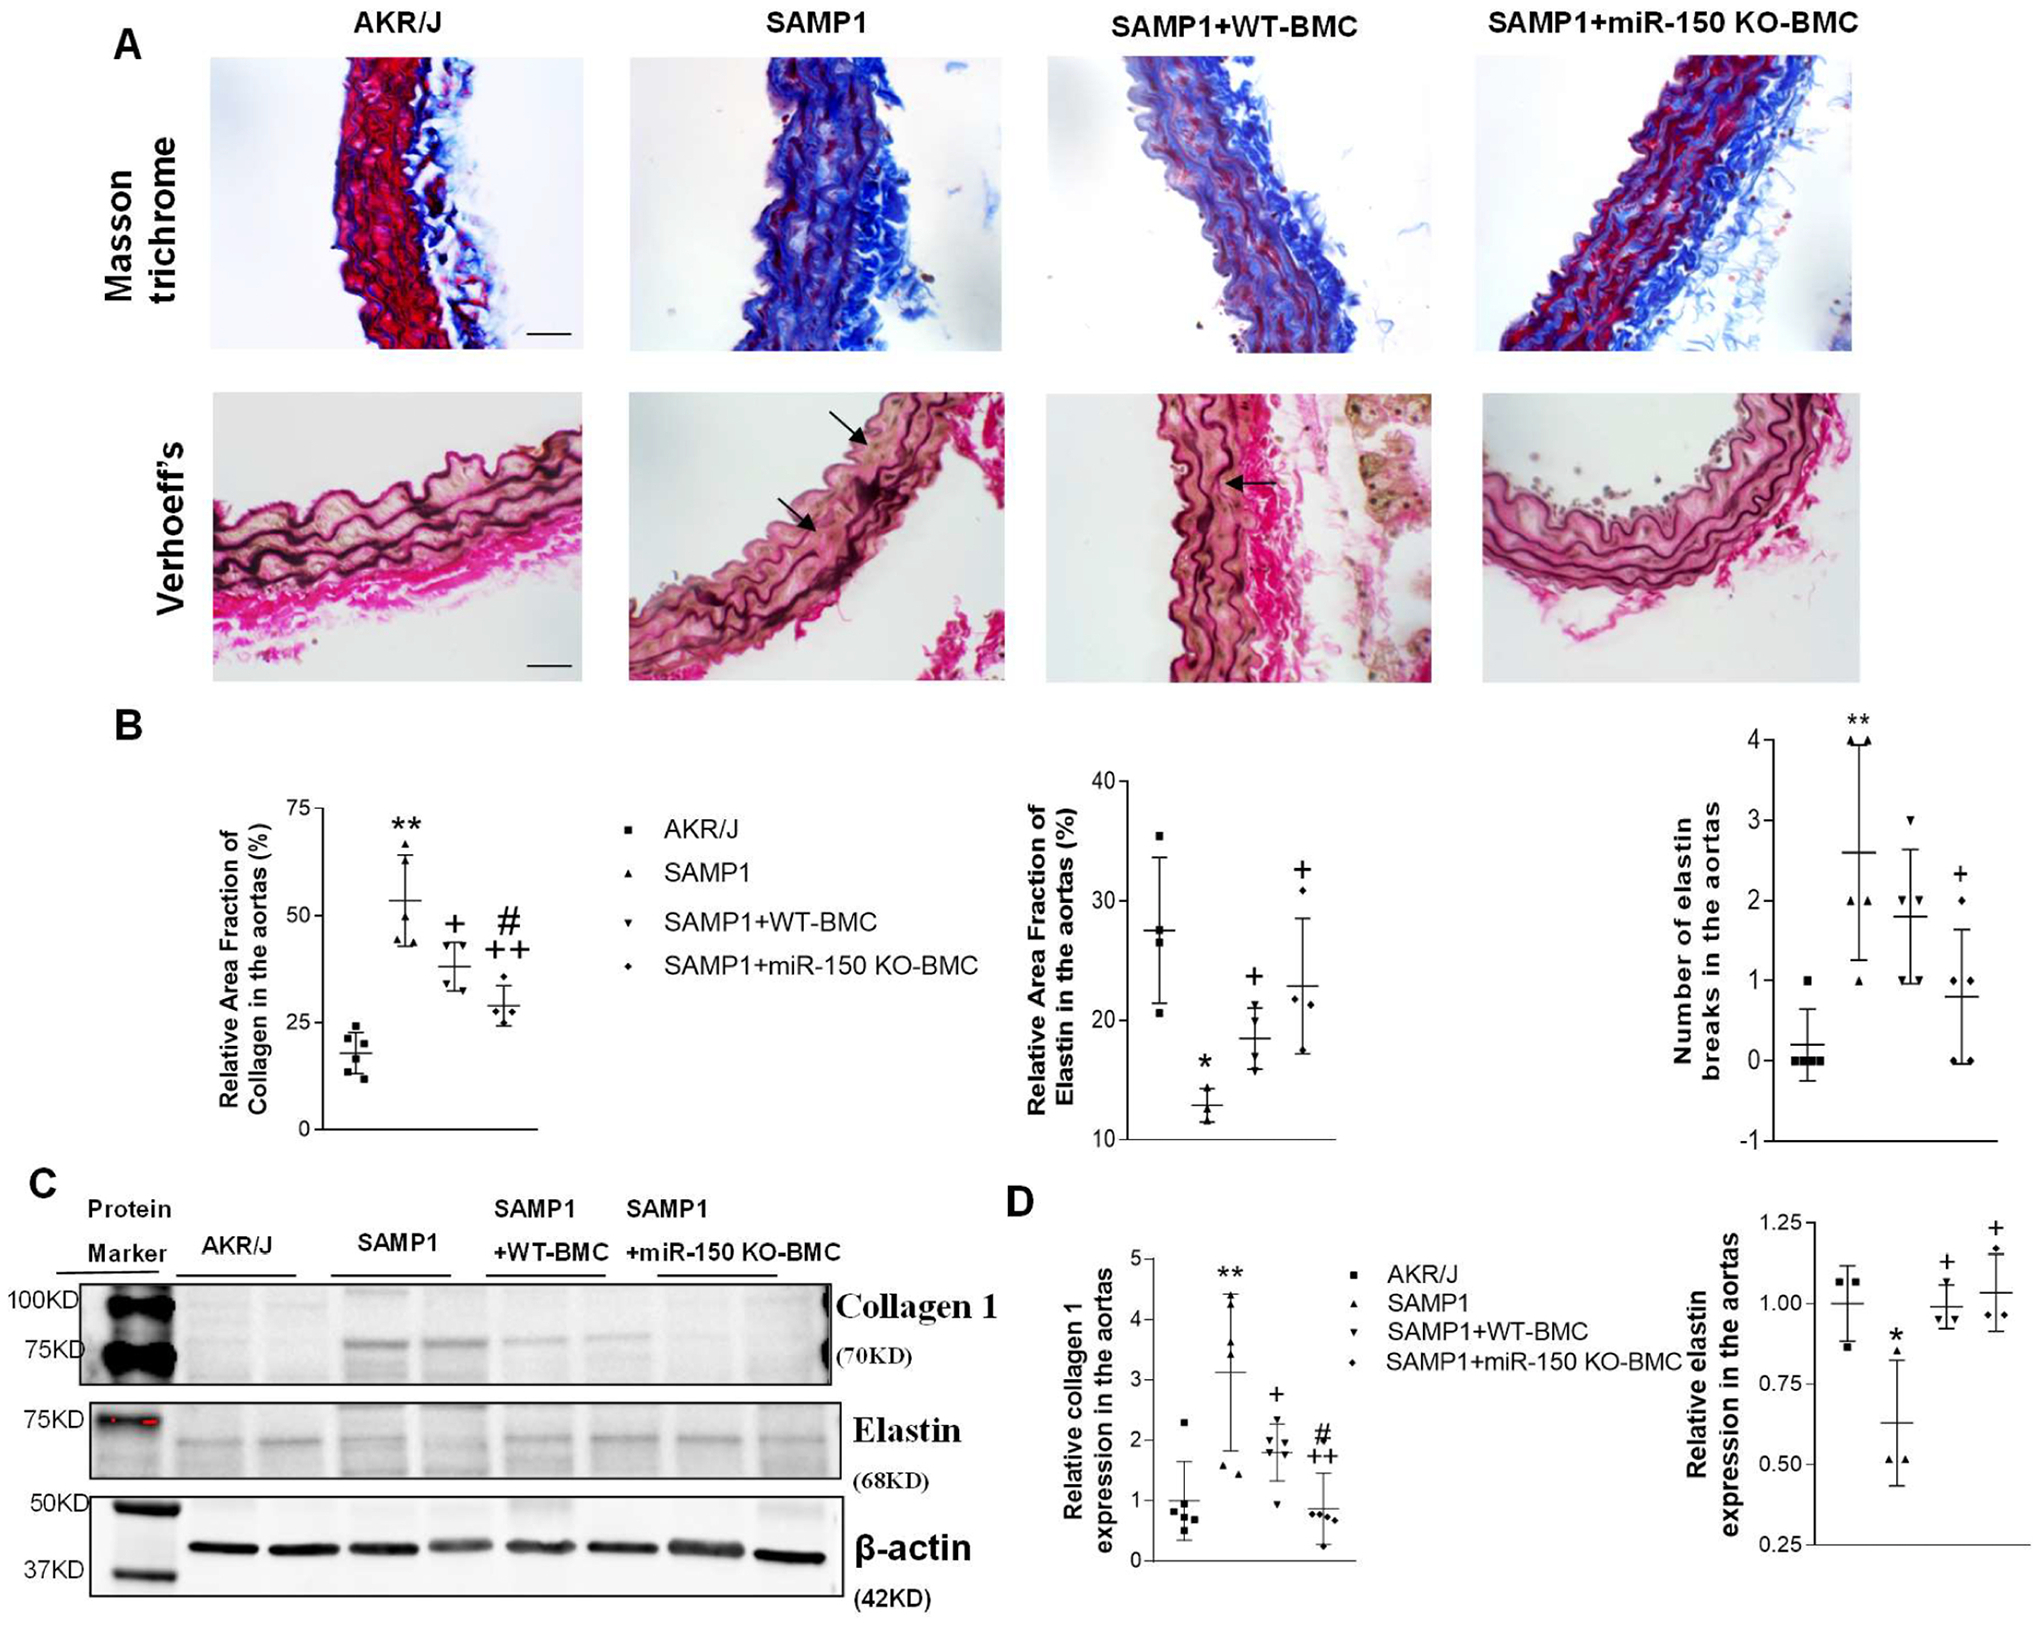
Figure 4.

Transplantation of BMCs from miR-150 KO mice abolished upregulation of collagen levels and downregulation of elastin levels in aortas in SAMP1 mice. The analysis was performed at 8 weeks after the BMT. (A). Upper panel, representative Masson-stained sections showing collagen levels in aorta. The blue staining indicates the collagen staining. Lower panel, representative Verhoeff’s-stained sections showing elastic lamella changes. The dark staining indicates the elastin staining. Arrows point to the elastin break in the aortic sections. Scale bar indicates 100 μm. (B) Relative area fraction of collagen and elastin in the aorta, and the number of elastin lamella breaks in the aortic sections. (C) Representative Western blot bands of collagen I and elastin. (D) Quantitative analysis of collagen 1 and elastin in the aorta. The target bands were first normalized with β-actin and then calculated as fold changes vs. the AKR/J group. Data = mean ± SEM (n=3–6). One-way ANOVA analysis with Bonferroni correction was performed. *P<0.05, **P<0.01 Vs AKR/J mice; +P<0.05, ++P<0.01 Vs SAMP1 mice; #P<0.05 Vs SAMP1+WT-BMC mice.
