Figure 5.

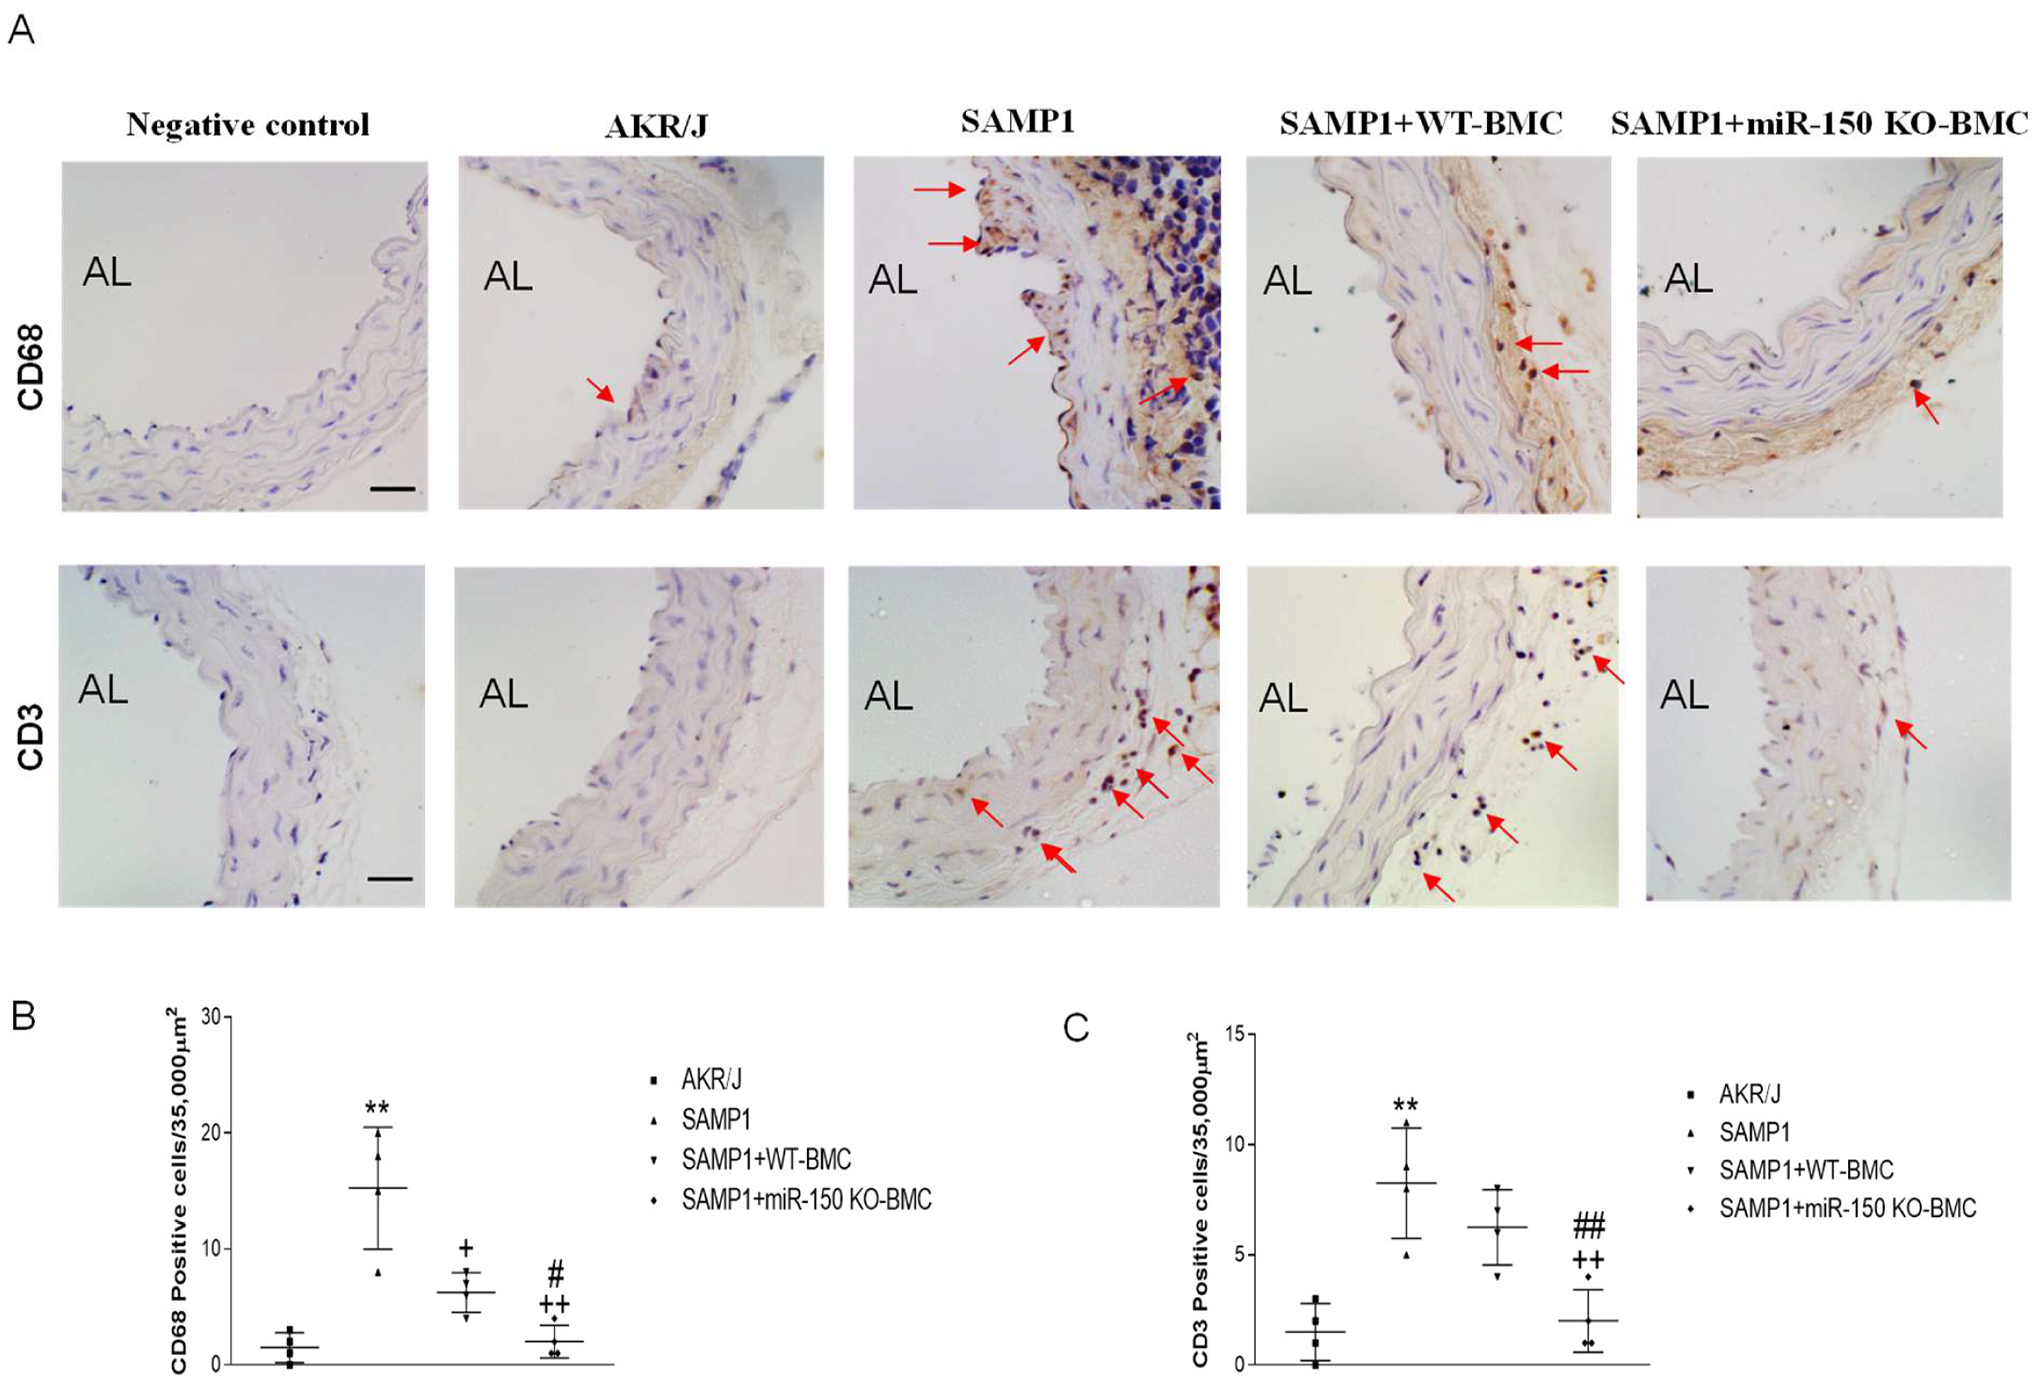
Transplantation of BMCs from miR-150 KO mice attenuated the infiltration of the inflammatory cells in aortas in SAMP1 mice. The analysis was performed at 8 weeks after the BMT. (A) Representative photomicrographs of CD68 (macrophages) and CD3 (T cells) immunostaining in aorta sections. Arrows point to positive staining (brown). Negative controls show sections stained without first antibodies. Semiquantitative analysis of infiltration of CD68+ cells (B) and CD3+ cells (C) in aorta sections. Scale bar indicates 100 μm. Data = mean ± SEM (n=4). One-way ANOVA analysis with Bonferroni correction was performed. **P<0.01 Vs AKR/J mice; +P<0.05, ++P<0.01 Vs SAMP1 mice; #P<0.05, ##P<0.01 Vs. SAMP1+WT-BMC mice.
