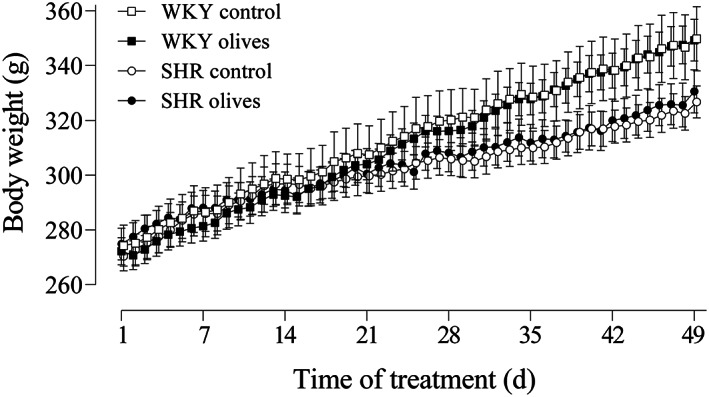
Figure 2.

Body weight in normotensive (WKY) rats and spontaneously hypertensive rats (SHR). The graph represents the time course of the WKY rats and SHR treated with ‘Arbequina’ table olives at a dose of 3.85 g kg−1 or water. Values are presented as mean ± standard error of the mean in the WKY control (n = 6), WKY olives (n = 7), SHR control (n = 7) and SHR olives (n = 8) groups. Body weight was analyzed by two‐way analysis of variance followed by the Fischer multiple comparison test; P > 0.05 control versus treated animals.
