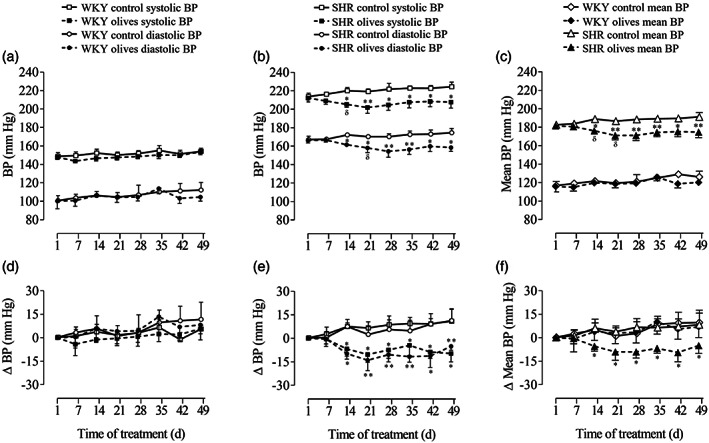
Figure 3.

Blood pressure (BP) in normotensive (WKY) rats and spontaneously hypertensive rats (SHR) after the daily oral administration of ‘Arbequina’ table olives at a dose of 3.85 g kg−1 or water. The graphs represent the time course over 7 weeks of the systolic, diastolic, mean, and ΔBP in (A, C, D, F) WKY rats and (B, C, E, F) SHR. Values are presented as mean + standard error of the mean (SEM) in the WKY (n = 6) and SHR (n = 7) control groups and as mean − SEM in the WKY (n = 7) and SHR (n = 8) olives groups. Only SEMs that exceed the size of the symbol are shown. Data were analyzed by two‐way analysis of variance followed by a Fischer multiple comparison test. Different from control rats: *, P < 0.05; **, P < 0.01. Different from day 1: δ, P < 0.05.
