Fig. 6.

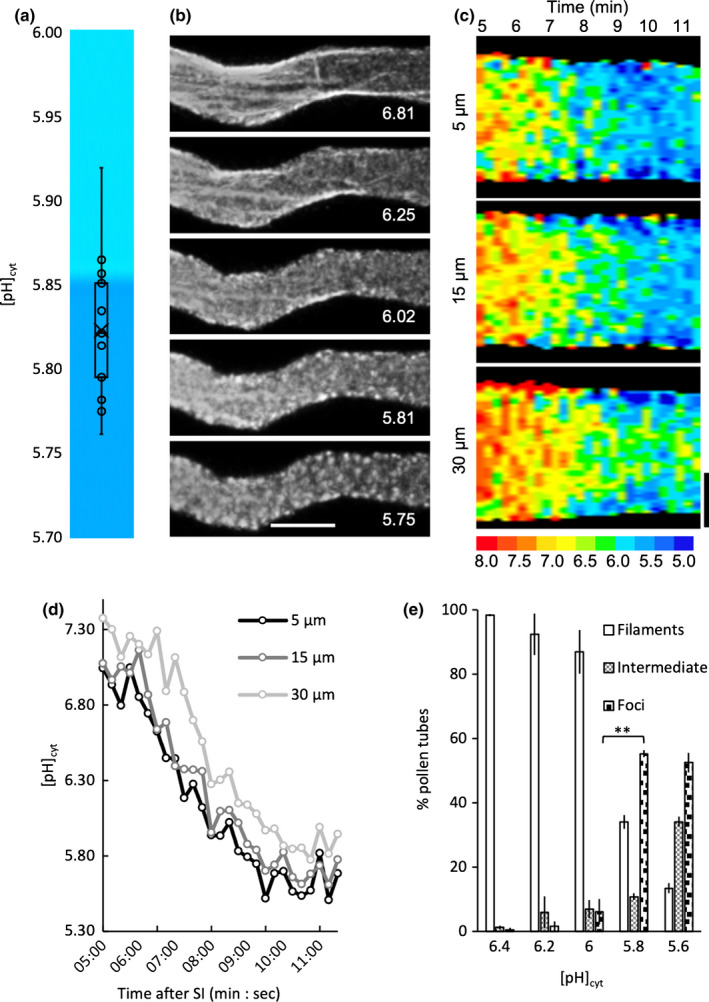
Identification of a cytosolic pH ([pH]cyt) threshold for actin foci formation. Pollen tubes from an Arabidopsis thaliana ‘rapid’ line co‐expressing PrpS1, pHGFP and Lifeact‐mRuby2 were ratio‐imaged to ascertain the [pH]cyt using pHGFP, calibrated by propionic acid, and to monitor actin (using Lifeact‐mRuby2) near‐simultaneously in the same pollen tube. (a) Quantification of the [pH]cyt values (for pseudocolour key see (c)) when actin foci extensively formed in pollen tubes after self‐incompatibility (SI) induction (n = 13). pH values correspond to an area of the pollen tube shank region 15–35 μm from the tip. (b) actin configurations in a representative pollen tube after SI induction; the corresponding [pH]cyt value for each image is indicated. Bar, 5 μm. (c) Kymograph analyses of [pH]cyt of a representative pollen tube over a period between 5 and 11.5 min after SI induction (indicated at the top of the kymograph). Three different 5‐μm‐wide regions of the pollen tube were analyzed (centred at 5, 15 and 30 μm from the tip) and reveals spatiotemporal differences in the changes in [pH]cyt. The pseudocolour scale shows the calibrated pH values. Bar, 2 μm. (d) Quantification of [pH]cyt within the three 5‐μm‐wide regions of the pollen tube shown in (c) centred at 5, 15 and 30 μm from the tip. This reveals that the region nearer the tip has a lower [pH]cyt than the region behind it and although it goes down, this differential is retained. (e) Percentage of pollen tubes showing three actin configurations (filaments, intermediate and foci) after treatment with propionic acid at different pHs (n > 100 per treatment over three independent repeats). Comparison between proportions of pollen tubes with actin foci at pH 6.0 and 5.8: **, P = 0.001, Student's t‐test. Error bars indicate ± SD.
