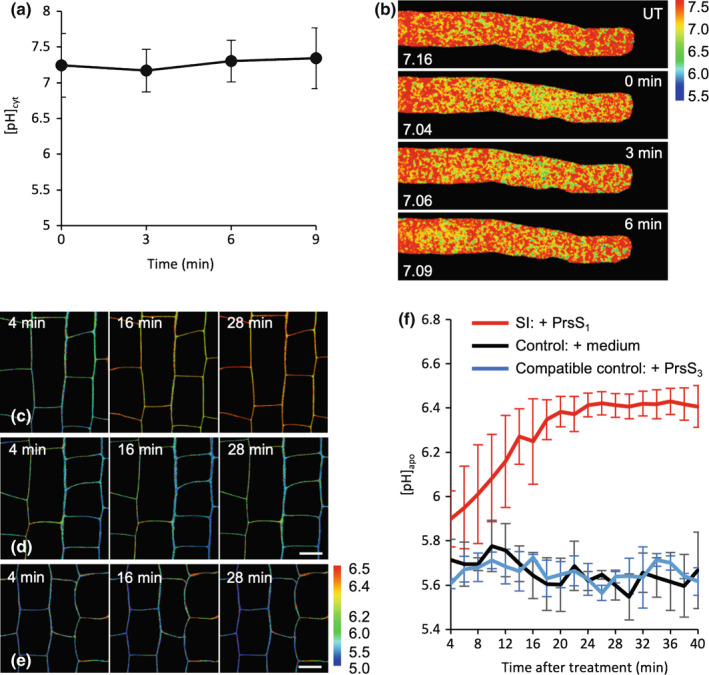
Fig. 8.

Evidence for H+ influx being triggered by PrpS‐PrsS cognate interaction. (a) Quantification of cytosolic pH ([pH]cyt) after self‐incompatibility (SI) induction in Arabidopsis thaliana pollen tubes co‐expressing PrpS1 and pHGFP in growth medium (GM) buffered with 50 mM PIPES, pH 7.0 (n = 3). The region of interest (ROI) used for quantification was 15–35 μm from the tip. Error bars indicate ± SD. P = 0.94, one‐way ANOVA. (b) Representative images of pollen tubes in GM buffered with PIPES (UT: note that pollen tube growth is inhibited by PIPES and there is no tip‐shank gradient) and after PrsS addition (t = 0, 3, 6 min). [pH]cyt values from the ROI are indicated. (c–e) PrsS triggers apoplast alkalinization in Arabidopsis seedling roots expressing cognate PrpS (pUBQ10::PrpS 1 ). Apoplast pH ([pH]apo) in basal meristem epidermis‐cortex of 4‐d‐old roots expressing PrpS1 was measured by ratiometric imaging of the fluorescent pH indicator 8‐hydroxypyrene‐1,3,6‐trisulfonic acid (HPTS). (c) Representative images showing an increase in [pH]apo after SI induction with PrsS1. Pseudocolour scale shows calibrated [pH]apo values. (d) and (e) Representative images of seedling roots after addition of medium (d) and recombinant PrsS3 as a compatible control (e). No increase in [pH]apo was detected in these two controls. Bars, 10 μm. (f) Quantification of [pH]apo measured in the imaged area showed a significant increase in [pH]apo after SI induction (P < 0.001, two‐way ANOVA comparing [pH]apo after SI induction with controls, error bars indicate ± SD, n = 6 for SI induced samples, n = 3 for each control group). P < 0.001, comparison between [pH]apo at 4 and 24 min after SI induction, Student's t‐test. No significant changes in [pH]apo after control treatments, comprising medium (black line, P = 0.53) or compatible PrsS3 (blue line, P = 0.29), one‐way ANOVA.
