
FIGURE 1.
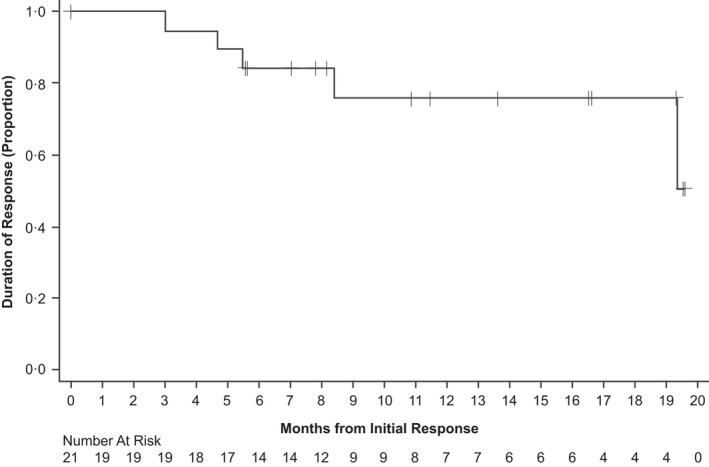
Kaplan–Meier plot of duration of response. Duration of response defined as the months from first documented response to disease progression, death, or date of censoring.
Official websites use .gov
A
.gov website belongs to an official
government organization in the United States.
Secure .gov websites use HTTPS
A lock (
) or https:// means you've safely
connected to the .gov website. Share sensitive
information only on official, secure websites.
Kaplan–Meier plot of duration of response. Duration of response defined as the months from first documented response to disease progression, death, or date of censoring.