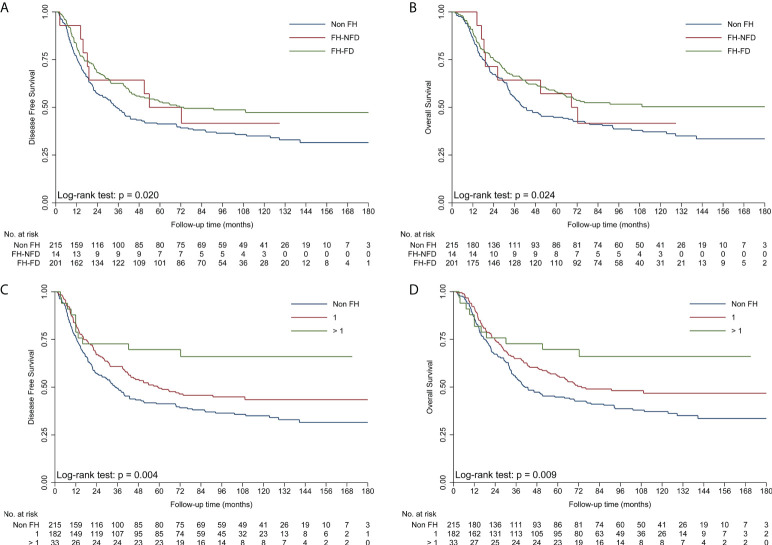
Figure 3.
Kaplan–Meier curves showing better DFS (A) and OS (B) in the FH-FD group than in the non-FH group, but not in the FH-NFD group; Kaplan–Meier curves showing better DFS (C) and OS (D) in patients with more than one relative affected by cancer than in patients in the non-FH group. DFS, disease-free survival; FH, family history of cancer; FH-DC, family history of digestive tract cancer; FH-NDC; family history of non-digestive tract cancer; FH-NFD, family history in non-first-degree; non-FH, no family history of cancer; OS, overall survival.

