
FIGURE 5.
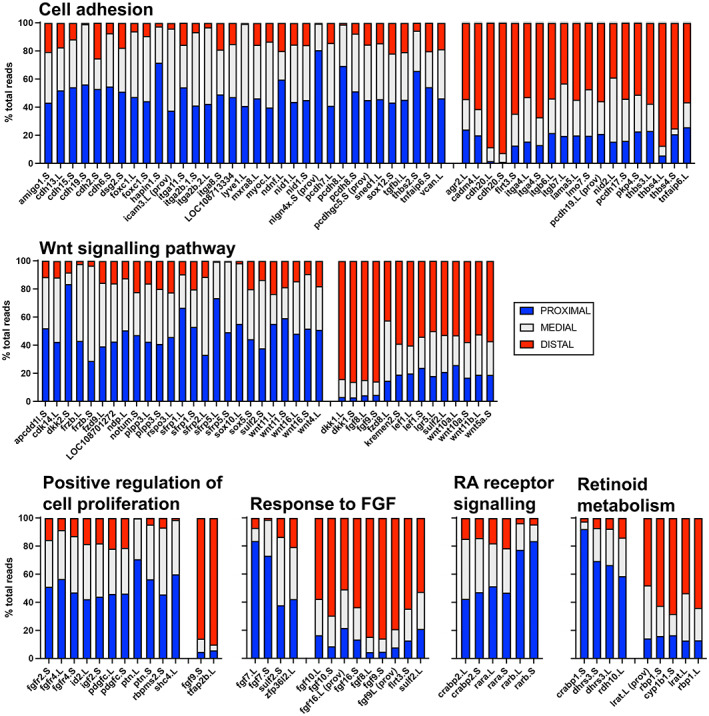
Relative distribution of read counts for genes in differentially expressed gene ontology gene sets for cell adhesion, Wnt signaling pathway, positive regulation of cell population proliferation, response to fibroblast growth factor, retinoic acid receptor signaling, and retinoid metabolism. Stacked graphs show the percentage of proximal reads is in blue, medial reads in grey, and distal in red. Genes with statistically more reads in distal than proximal are on the left and those more proximal on the right, and are ordered alphabetically within each group.