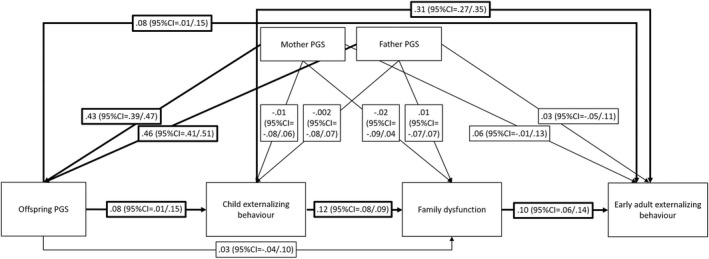
Figure 2.

Path model testing evocative gene–environment correlation. N = 2,732, the model is just‐identified. Reported estimates are standardized with bootstrapped 95% confidence intervals in brackets. Significant estimates are highlighted by bold arrows. Childhood externalizing behavior, family dysfunction, and early adult externalizing behavior were derived as factor scores from factor models (see Appendix S4 for detail) and regressed on sex before computing the path model; included here are therefore residual variances after controlling for sex. Polygenic scores were regressed on 20 principal components; included here are therefore residual variances following this step. R 2 for child externalizing behavior = .01, p = .220, R 2 for family dysfunction = .02, p = .003; R 2 for early adult externalizing behavior = .14, p < .001. The correlation between parents' polygenic scores is r = .05 (95%CI = −.02/.11)
