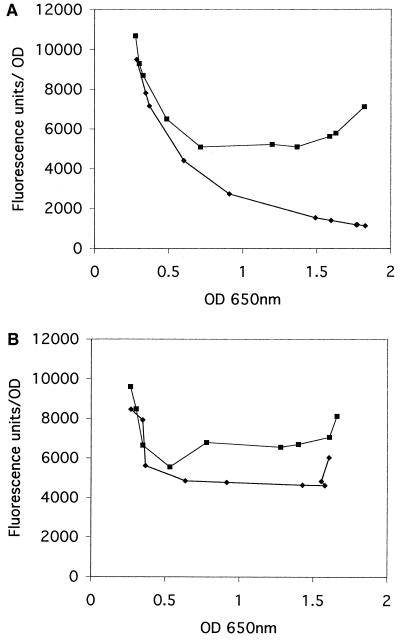
FIG. 7.
Promoter activation of sar P1 and combined P2-P3-P1 promoters fused to a gfpuvrreporter gene as evaluated in a fluorescence spectrophotometer (FL600; BioTek Instruments). (A) Recombinant shuttle plasmid pALC1484 containing the sar P1 promoter linked to gfpuvr(excitation maxima at 488 nm) was introduced into strain RN6390 (♦) and its isogenic sarR mutant ALC1713 (▪). A negative control (RN6390 containing pALC1484 with no promoter fragment) showed no significant background fluorescence (background = ∼300 fluorescence units [data not shown]). Cells were obtained hourly (200 μl of each in duplicate) during the growth cycle (from h 2 to 10 after an initial dilution of 1:100 in fresh medium) to obtain fluorescence and OD values in the same instrument. To minimize variations in fluorescence attributable to cell density, the data are presented as average of reported fluorescence per OD unit in triplicate samples plotted against the mean OD. The error bar was too small to be discerned (typically less than 100 fluorescence units). The experiment was repeated at least thrice; one representative experiment is shown. (B) Plot similar to that in panel A except that the combined sar P2-P3-P1 promoter fragment was used in place of the P1 promoter in the recombinant pALC1484 containing the gfpuvrreporter gene. In similar assays with the individual sar P2 and P3 promoters linked to the gfpuvrreporter in the isogenic pair, we detected no differences in GFPuvr expression between the parental strain and the sarR mutant. However, the level of fluorescence associated with individual P2 and P3 promoters was very low and only slightly above background levels.

