
FIGURE 3.
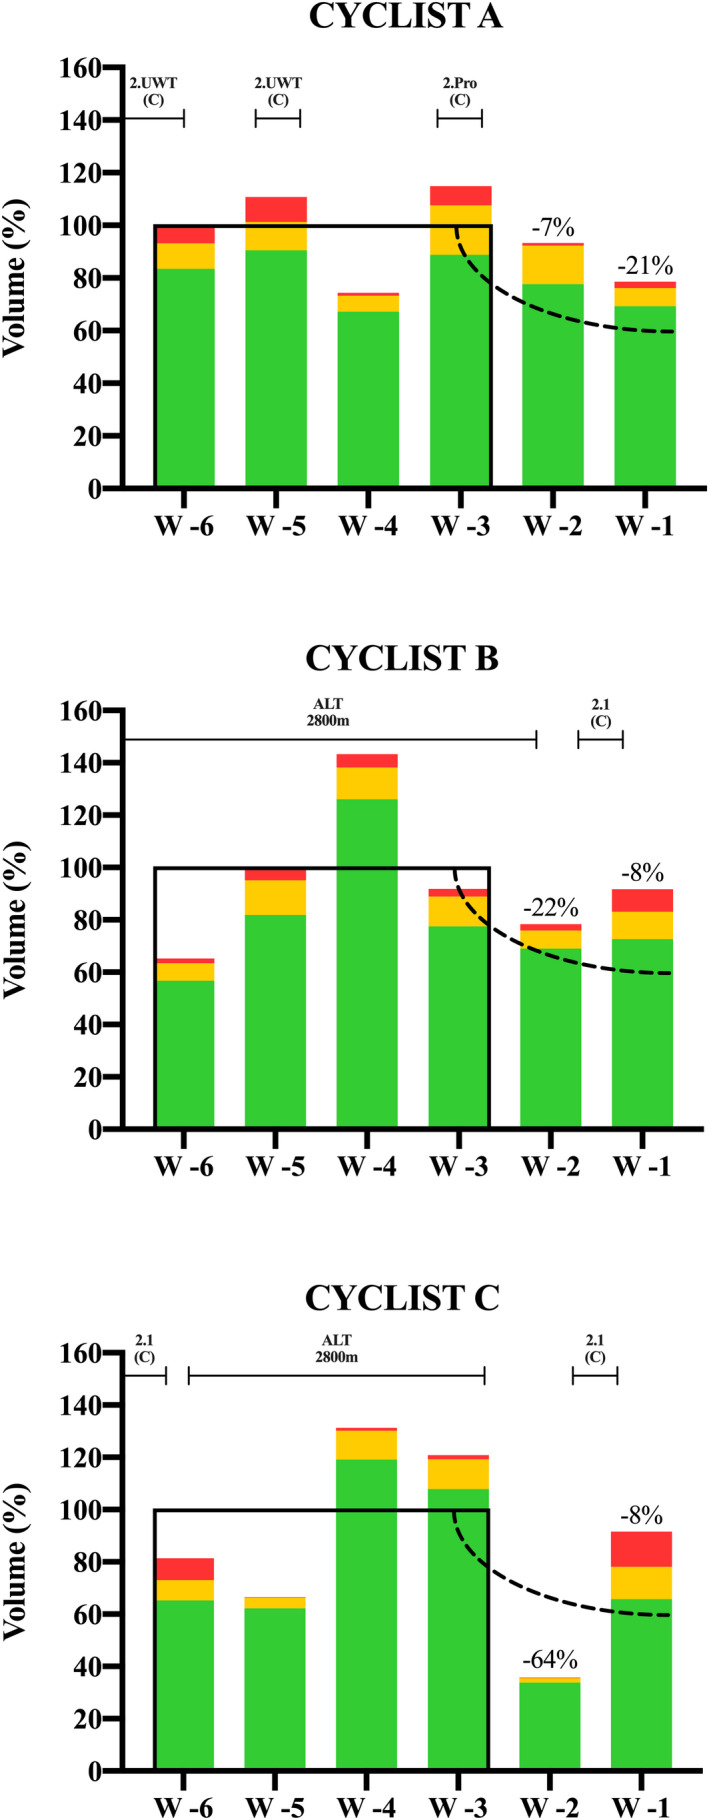
Volume and intensity distribution during the 6 weeks preceding the Giro d'Italia. Black lines represent the average volume for Weeks −3/−6; dot lines represent the suggested taper based on the literature recommendations. Altitude camps (ALT) and race type and priority are reported above each graph