Figure 1.

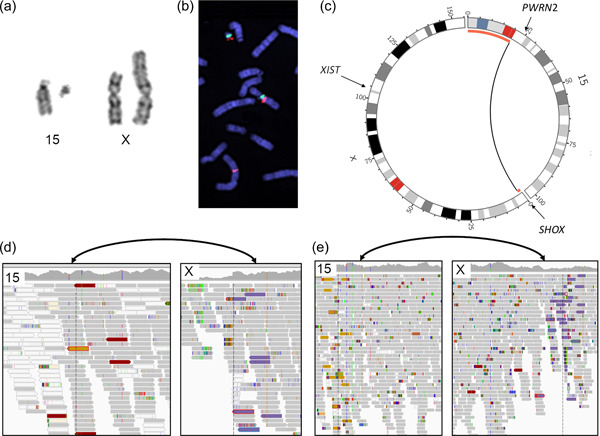
Chromosome analyses using cytogenetics and WGS. (a) The karyotype of the balanced X;15 translocation. (b) FISH mapping of metaphases from the mother showing BAC RP11‐622H13 split between 15q11.2 and Xp22.33. A probe specific to Centromere 15 is shown in green. (c) Circos plots illustrating the familial translocation, the black arc indicates the breakpoint positions and the red bars indicate regions deleted in the daughters due to unbalanced segregation. (d) and (e) IGV screenshots illustrating the breakpoint regions in daughter 1 (short read WGS) (d), and unaffected mother (linked read WGS) (e). For both (d) and (e), a bidirectional arrow in black indicate the location of the breakpoints and the discordant read pairs pinpointing the translocation are highlighted in gold (chr15) and purple (chrX). FISH, fluorescent in situ hybridization; IGV, Integrative Genomics Viewer.
