Figure 3.

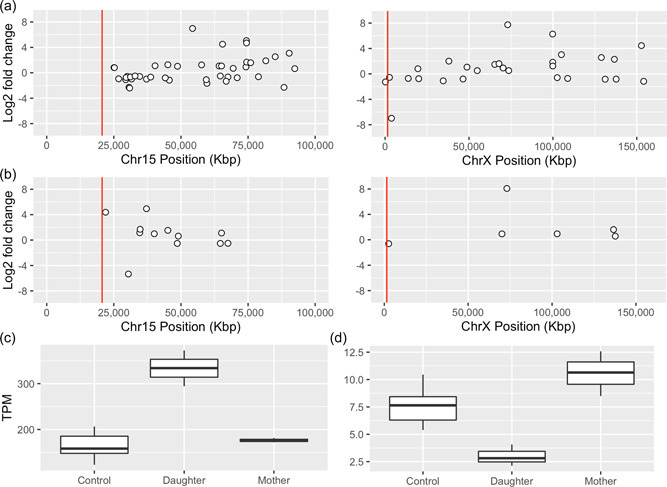
Differential expression analysis of daughter 1 and her mother. Differentially expressed genes on chromosome 15 and chromosome X in the daughter (a), and the mother (b). The log fold values are shown on the Y‐axis, and chromosomal position on the X‐axis, the red line indicate the breakpoint position of the t(15;X). (c) Boxplot illustrating the SNRPN expression levels in controls, daughter 1, and mother. (d) Boxplot illustrating the PLCXD1 expression level in controls, daughter 1, and mother.
