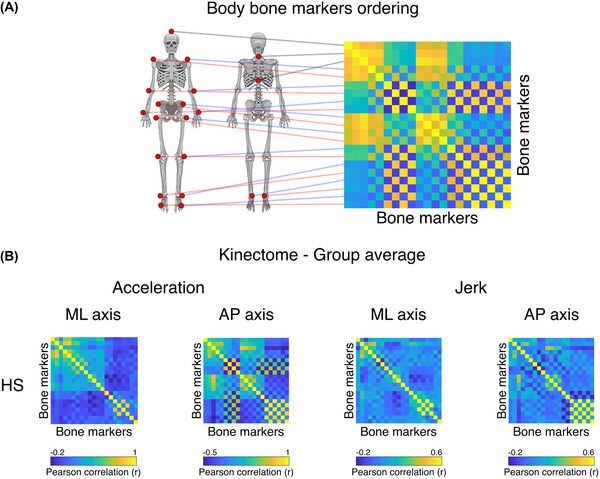
FIGURE 3.

From bones to kinectomes. (A) Illustration of the bone markers position on the kinectome. Each kinematic information derived from each bone marker is used as entry data for both rows and columns. The edges of the kinectome stem from the pairwise interaction between bone markers. (B) Acceleration and jerk kinectomes averaged among healthy subjects (HS) in the mediolateral (ML) and the anteroposterior (AP) axes. The interactions between body elements vary according to both the specific axis and measurement (acceleration or jerk).
