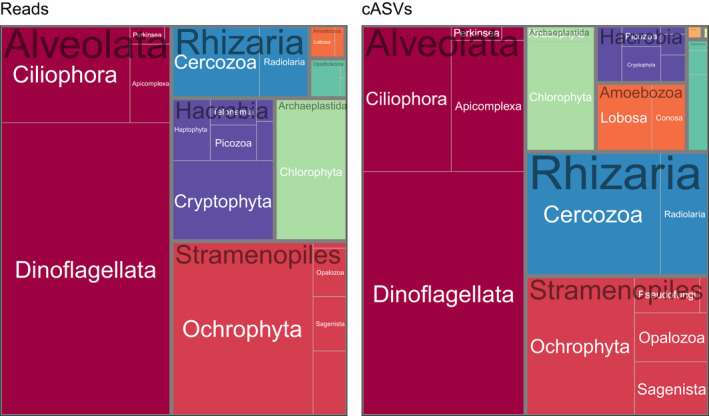
FIGURE 3.

Treemaps of most abundant protist taxa (supergroup and division) for V4 data sets based on number of reads after normalization (left) or number of clustered ASVs (cASVs, right)

Treemaps of most abundant protist taxa (supergroup and division) for V4 data sets based on number of reads after normalization (left) or number of clustered ASVs (cASVs, right)