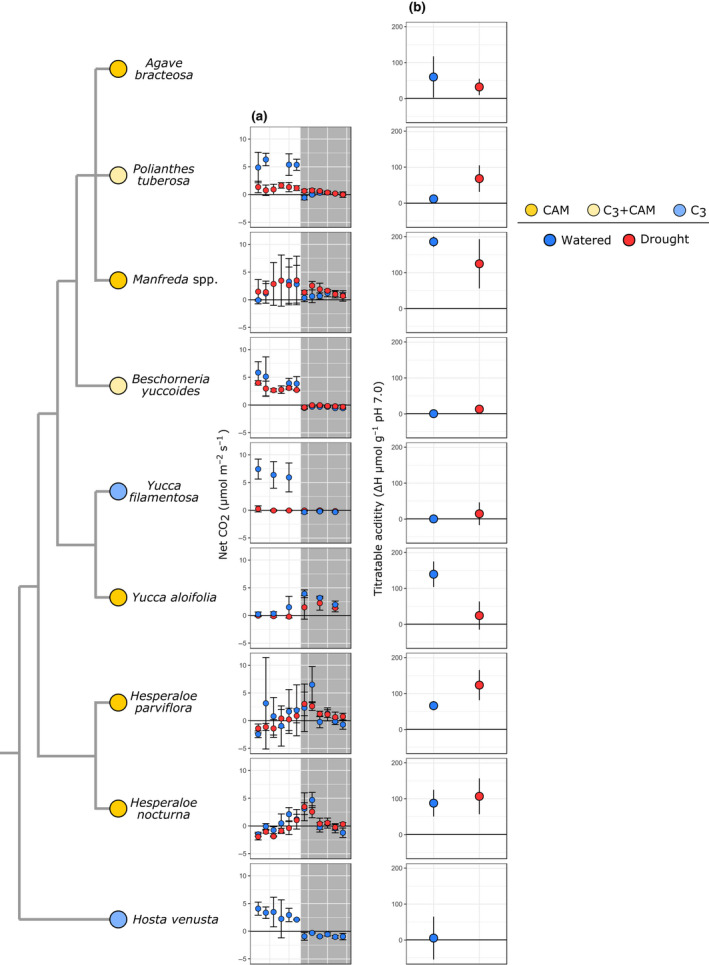
Fig. 2.

Photosynthetic physiology of species in the Agavoideae. Species relationships are represented by the cladogram to the left; A (net photosynthesis, or the net flux of CO2 per second per area), with shaded areas representing night time points (a); and the daily change in titratable leaf acidity (H μmol g−1 in the early morning – late afternoon) (b); are shown per species, with means and standard errors calculated from replicates of each species. Colours next to species names indicate Crassulacean acid metabolism (CAM) (bright yellow), C3 + CAM (pale yellow), and C3 (blue). Data for all species except Hesperaloe and Hosta comes from previous work (Heyduk et al., 2018b, 2019b).
