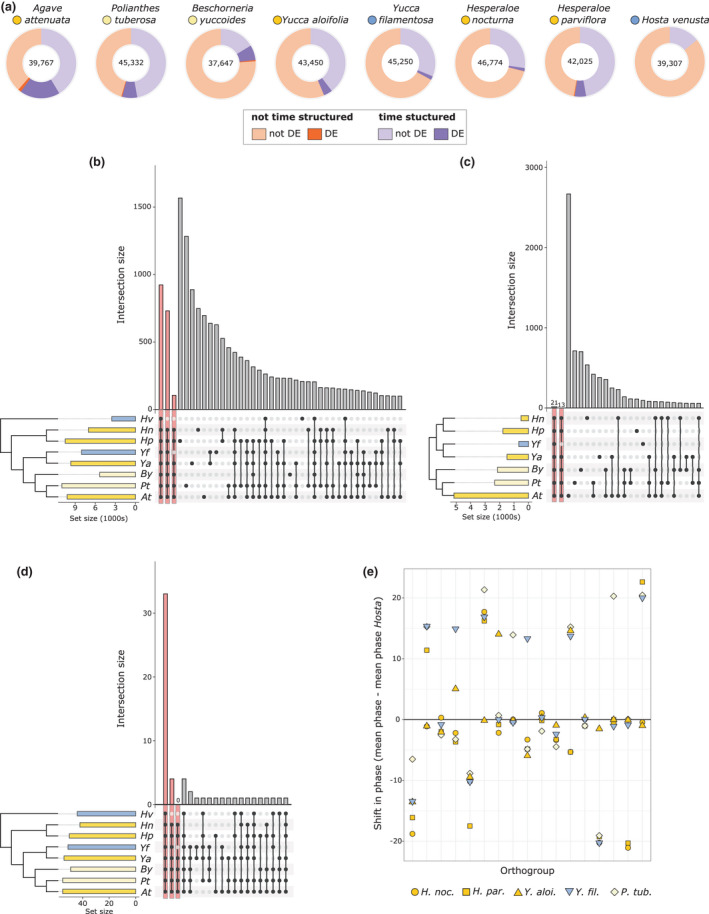
Fig. 3.

(a) Total number of transcripts assessed in each species (centre), with a proportion of the transcripts showing significant time‐structured expression (purple shades). A subset of both time‐structured and not time‐structured transcripts (orange shades) were differentially expressed (DE) under drought conditions (darker shades). (b) upSet plot showing overlap in gene families (orthogroups from OrthoFinder) that were time structured across the eight species; bars on left of the species names indicate total number of gene families per species, colours indicate Crassulacean acid metabolism (CAM) (bright yellow), C3 + CAM (pale yellow), and C3 (blue). The same colour scheme is used for panels (b–e). The first three bars highlighted in pink indicate orthogroups shared across all species, across all species except Hosta, and across all CAM species. (c) Comparison of gene families that had differential expression under drought stress across seven of the eight species (Hosta venusta was not droughted). (d) Comparison of gene families with core circadian clock annotations that had time‐structured expression across all eight species. (e) Shift in mean phase relative to H. venusta (mean phase of species – mean phase in H. venusta) in 17 gene families that had significantly different (P < 0.01) cycling across species as indicated by metaCycle.
