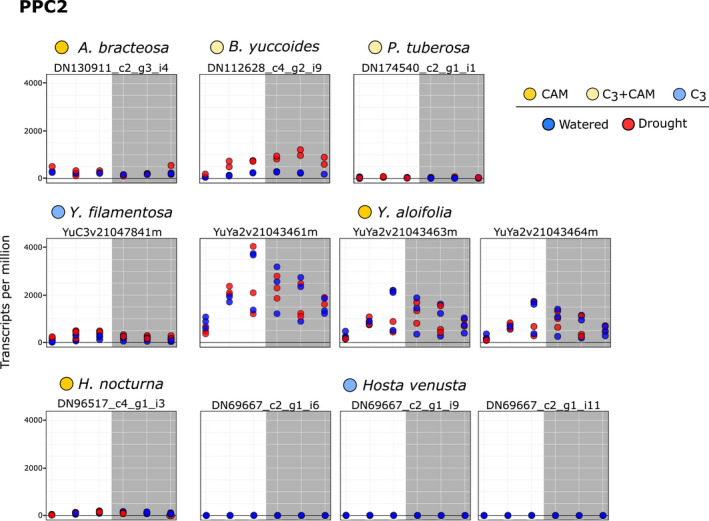
Fig. 6.

Expression (transcripts per million) of PPC2 transcripts from the core Agavoideae species. Dots represent individual samples, with blue, well watered and red, drought stressed. Colours next to species names indicate Crassulacean acid metabolism (CAM; bright yellow), C3 + CAM (pale yellow), and C3 (blue). Grey boxes indicates night time points. Transcripts are only shown here if they passed length and percentage identity filtering.
