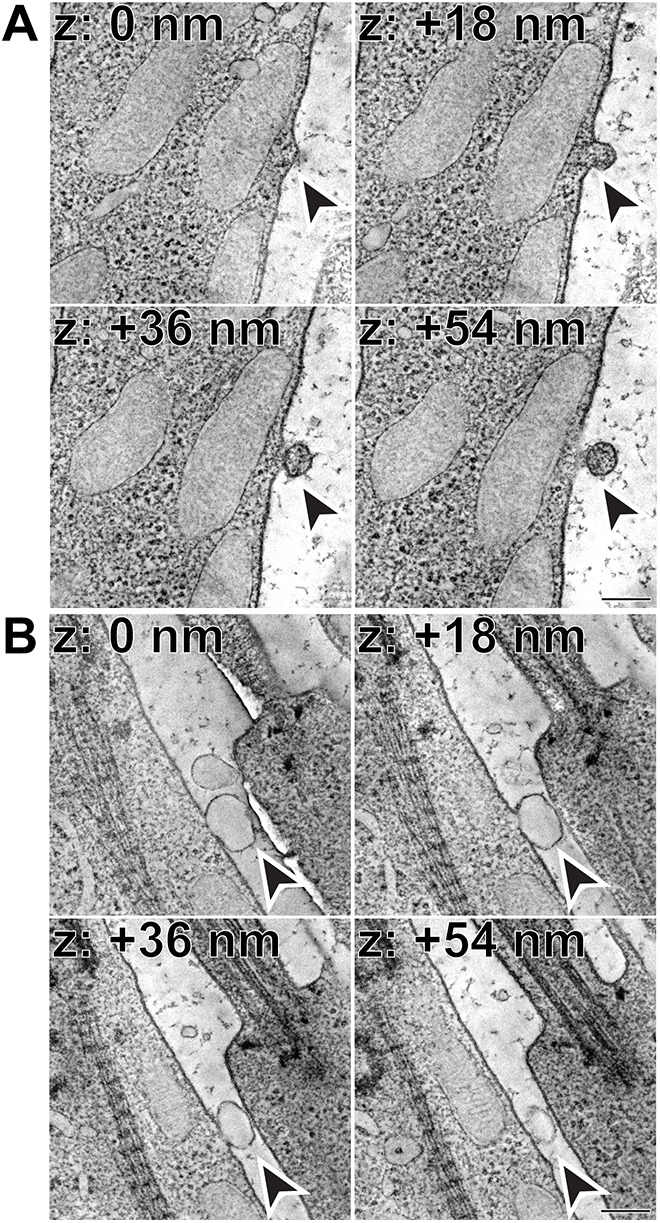
Fig. 2.

Microvesicles released from the inner segment plasma membrane. (A) Representative z-sections at the depths of 0, +18, +36 and +54 nm obtained from a 3D electron tomogram of a 250 nm-thick WT mouse retinal section stained with tannic acid/uranyl acetate. Full tomogram is shown in Movie 1. Arrowheads depict a microvesicle with a staining pattern matching that of the cytoplasm in the process of being released. Tomogram pixel size is 1.4 nm; scale bar: 0.2 µm. (B) Representative z-sections at the depths of 0, +18, +36 and +54 nm obtained from a 3D electron tomogram of a 250 nm-thick WT mouse retinal section stained with tannic acid/uranyl acetate. Full tomogram is shown in Movie 2. Arrowheads depict a clear microvesicle in the process of being released. Tomogram pixel size is 1.4 nm; scale bar: 0.2 µm. The data are selected from a total of six tomograms documenting microvesicle release from the plasma membrane obtained from three WT mice.
