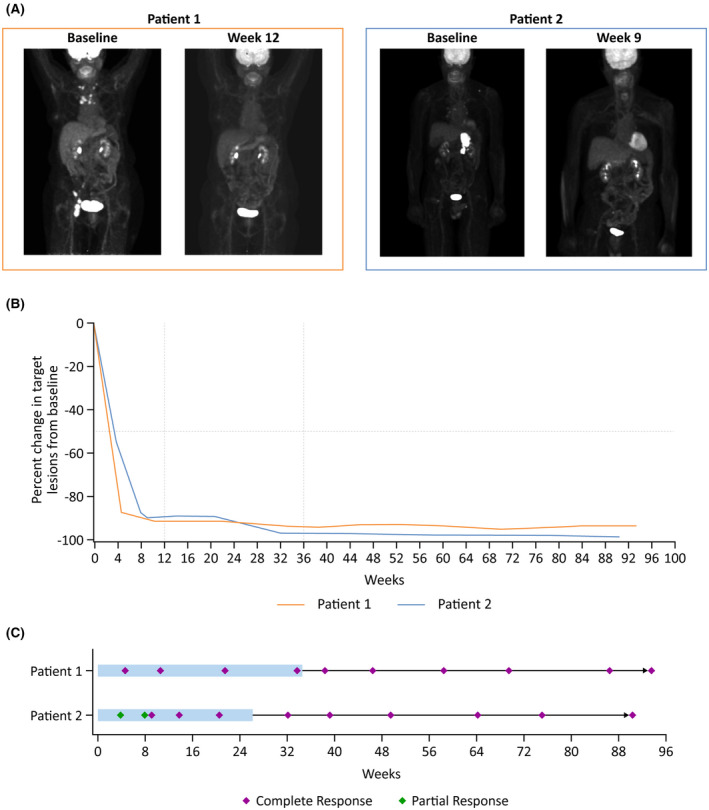
FIGURE 1.

Assessment of response to odronextamab. PET scans (A), change from baseline in tumour size (SPD) (B) and swimmer plot (C). (A) Patient 1 had a complete response at the week 12 assessment by PET (Deauville 1). Patient 2 had a complete response at the week 9 response assessment by PET (Deauville 3). (B) Patient 1 had a complete response by CT measurement at first response assessment. Patient 2 had an initial partial response by CT measurement, but rapid transition to complete response. (C) Both patients had sustained complete responses during and following treatment completion. Shaded bars represent the on‐treatment period. CT, computed tomography; PET, positron emission tomography; SPD, sum of products of diameters.
