
FIGURE 2.
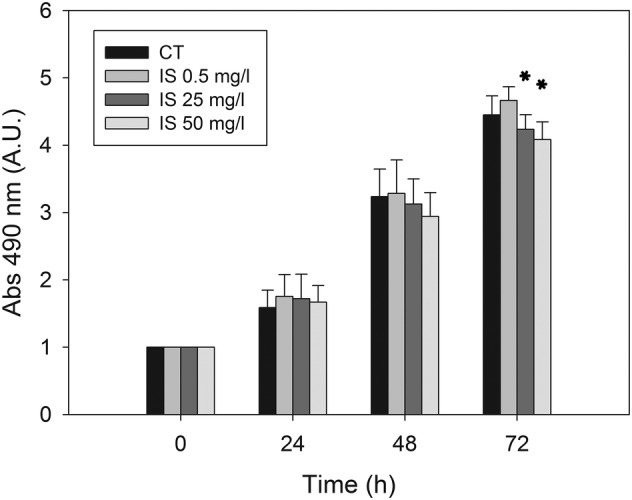
Effect of IS on HMEC‐1 cell proliferation measured by SRB assay: Histograms showing the mean absorbance measured at 490 nm in control cells and cells treated with 0.5, 25 or 50 mg/L of IS for 0, 24, 48 or 72 h. Data are expressed as the mean ± SD of four independent experiments. *p < 0.05.