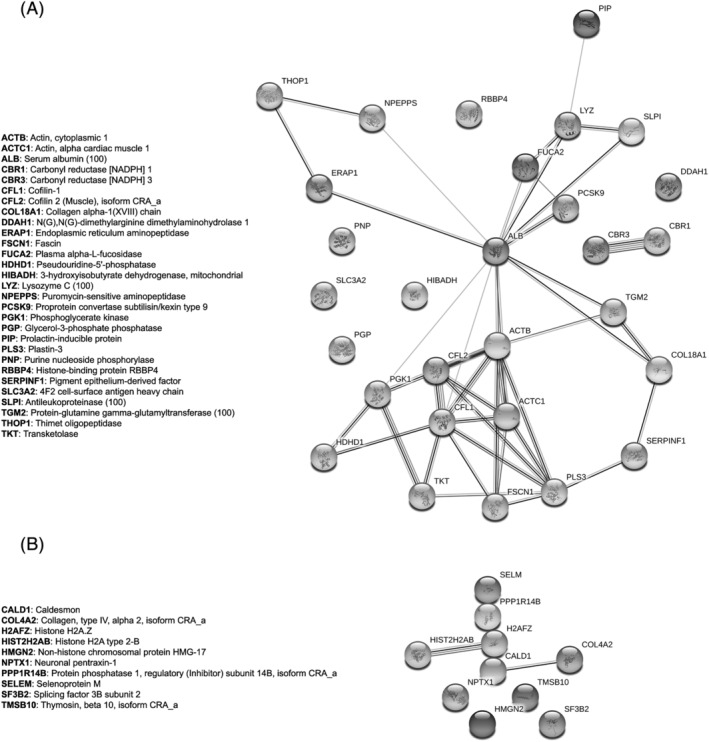
FIGURE 9.

Network of the regulated proteins obtained with the software String: (A) The network includes the proteins that emerged as up‐regulated in the medium of HMEC‐1 cells treated with 50 mg/L IS compared with those treated with 0.5 mg/L IS, at 72 h after the start of the treatment. (B) The network includes the proteins that emerged as down‐regulated in the medium of HMEC‐1 cells treated with 50 mg/L IS compared with those treated with 0.5 mg/L of IS, at 72 h after the start of the treatment.
